
Speeding on my street: how many cars go over the limit?
Two evenings of recording show how many cars pass your home, at what speeds, and at which hours the highest share of them goes over the limit.
Speeding on your street can feel constant, and a few fast cars are easy to remember and hard to count. A recording counts all of them. Set an iPhone in your window, looking across the road, let SpeedCam AI record two evenings, and open the Analytics tab: how many vehicles passed, their typical speed, and the share that were over the limit you set. The cars over your limit by the margin you choose are saved with photos too, and Pro opens each one.
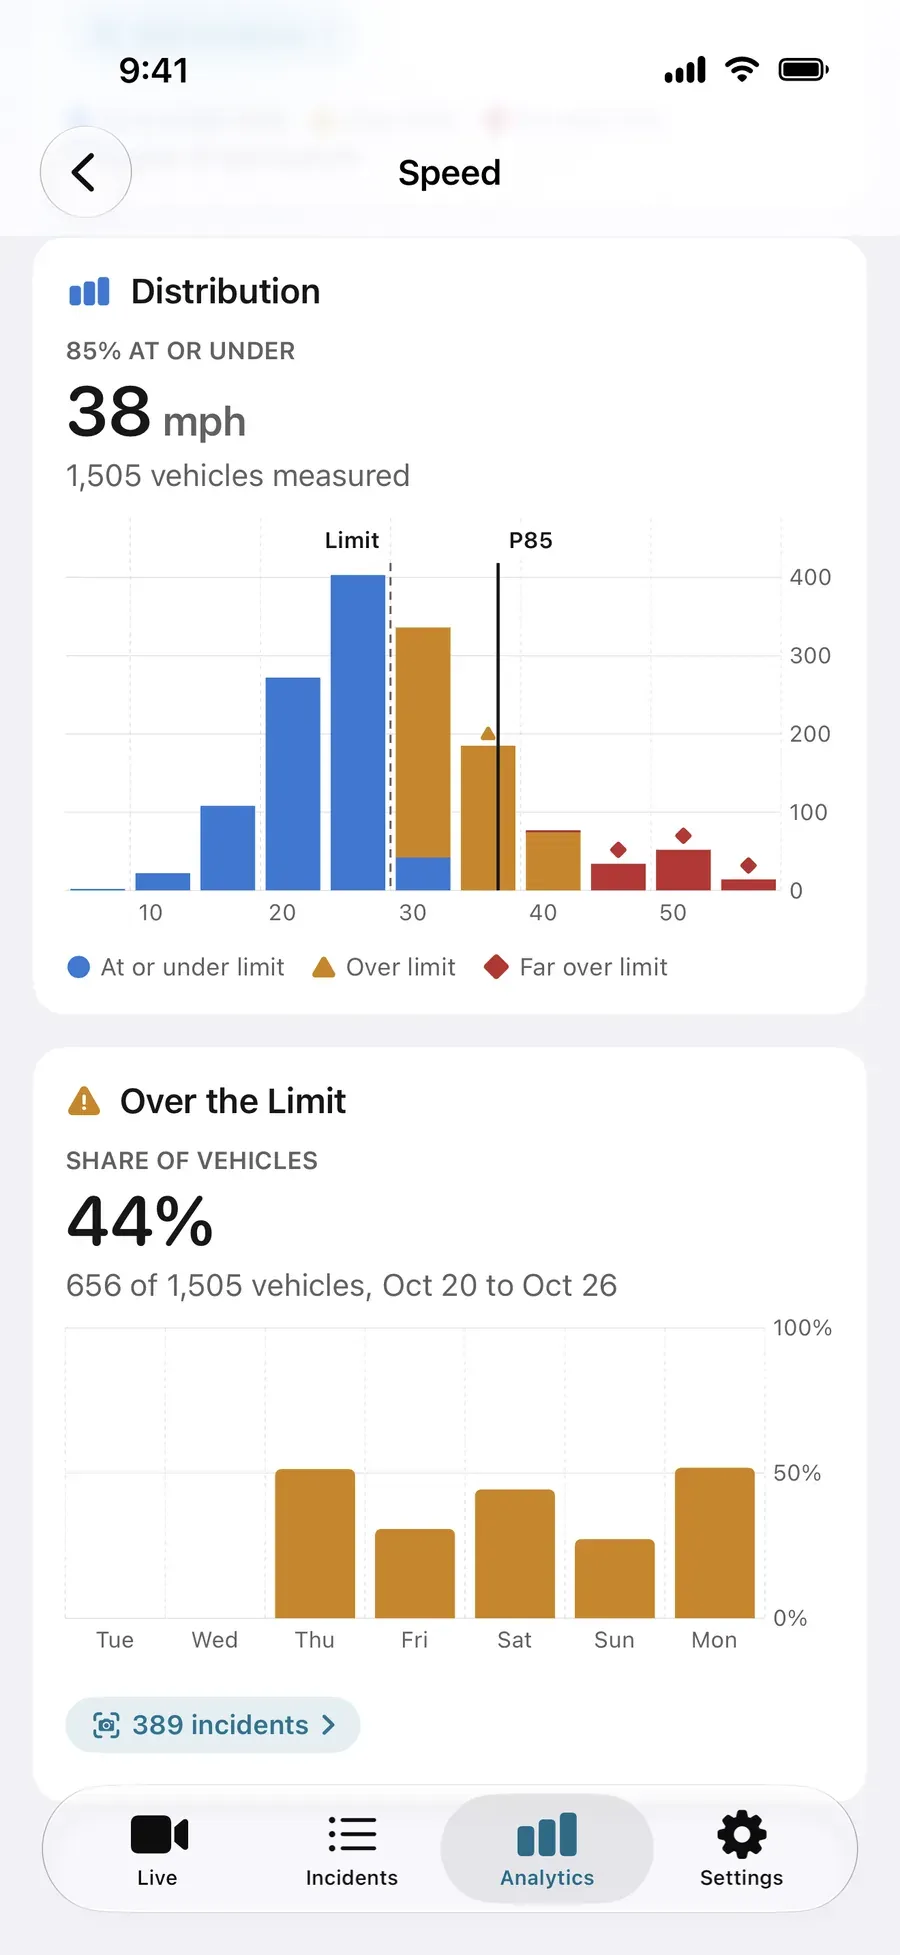
What two evenings of recording show
| What you want to know | Where SpeedCam AI shows it |
|---|---|
| How many cars pass your home | Vehicles, the first card in Analytics |
| How fast most of them go | Typical Speed (the median), and the speed 85% of traffic stays at or under on the Speed card |
| How many go over the limit | Over Limit, the share of measured vehicles over the limit you set |
| Which cars went over | The Incidents tab, each car over your limit by the margin you choose, with its photo (Pro opens all its photos) |
| At which hours | When, a grid of weekdays by hour, switched to Over Limit |
1. Set your street’s limit
Open Settings › Capture › Speed Limit and choose the limit on your street, in mph or km/h. You can also set it in the New Session sheet when you start recording, so a session on a 25 mph street and one on a 35 mph road each count against their own limit.
Two settings answer two different questions:
- Speed Limit is what the charts measure against. Every measured vehicle counts towards the share over the limit.
- Incident Recording decides which vehicles are saved as incidents, with photos: any speeding, or only vehicles a set amount over the limit (5 mph over by default).
2. Put the phone where it reads best
Set the iPhone in a window or on a tripod, looking across the road and turned a little to one side, so cars cross the picture rather than drive towards it. Keep the lane you want to measure close enough that a passing car fills at least a quarter of the picture’s width.
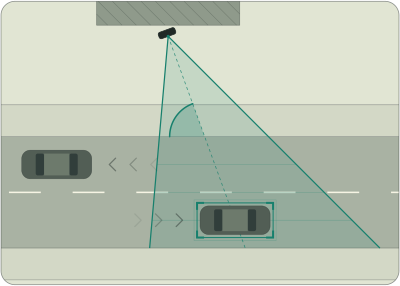
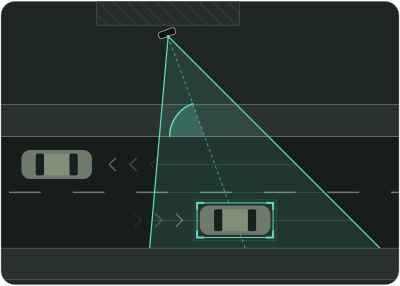
For more accurate speeds, measure how high the phone sits above the road and enter it in Settings › Capture › Camera height. The walkthrough in Measure the speed of passing cars with your iPhone covers placement in more detail.
3. Record two evenings, then a morning
Tap Start Detecting in the bar at the bottom of the Live view and leave the phone on screen, on charge. Two evenings give you a first picture of your street; a weekday morning and a weekend show whether it holds. Give each session the same Campaign name in the New Session sheet, such as “Oak St”, and the charts roll them up together.
The app learns your view from the passing traffic first: the status at the top reads “Learning this view” and then “Measuring”. Speeds show from the start, every vehicle counts, and incidents are saved once it reads Measuring.
Recording is free. Without Pro, each session is kept on your iPhone, locked, and Analytics shows its Vehicles, Typical Speed and Over Limit on the Locked card. The charts, each car’s photos and the PDF report open with Pro, and Load Demo Data on an empty Analytics screen lets you try every chart before you subscribe.
4. Read the share over the limit
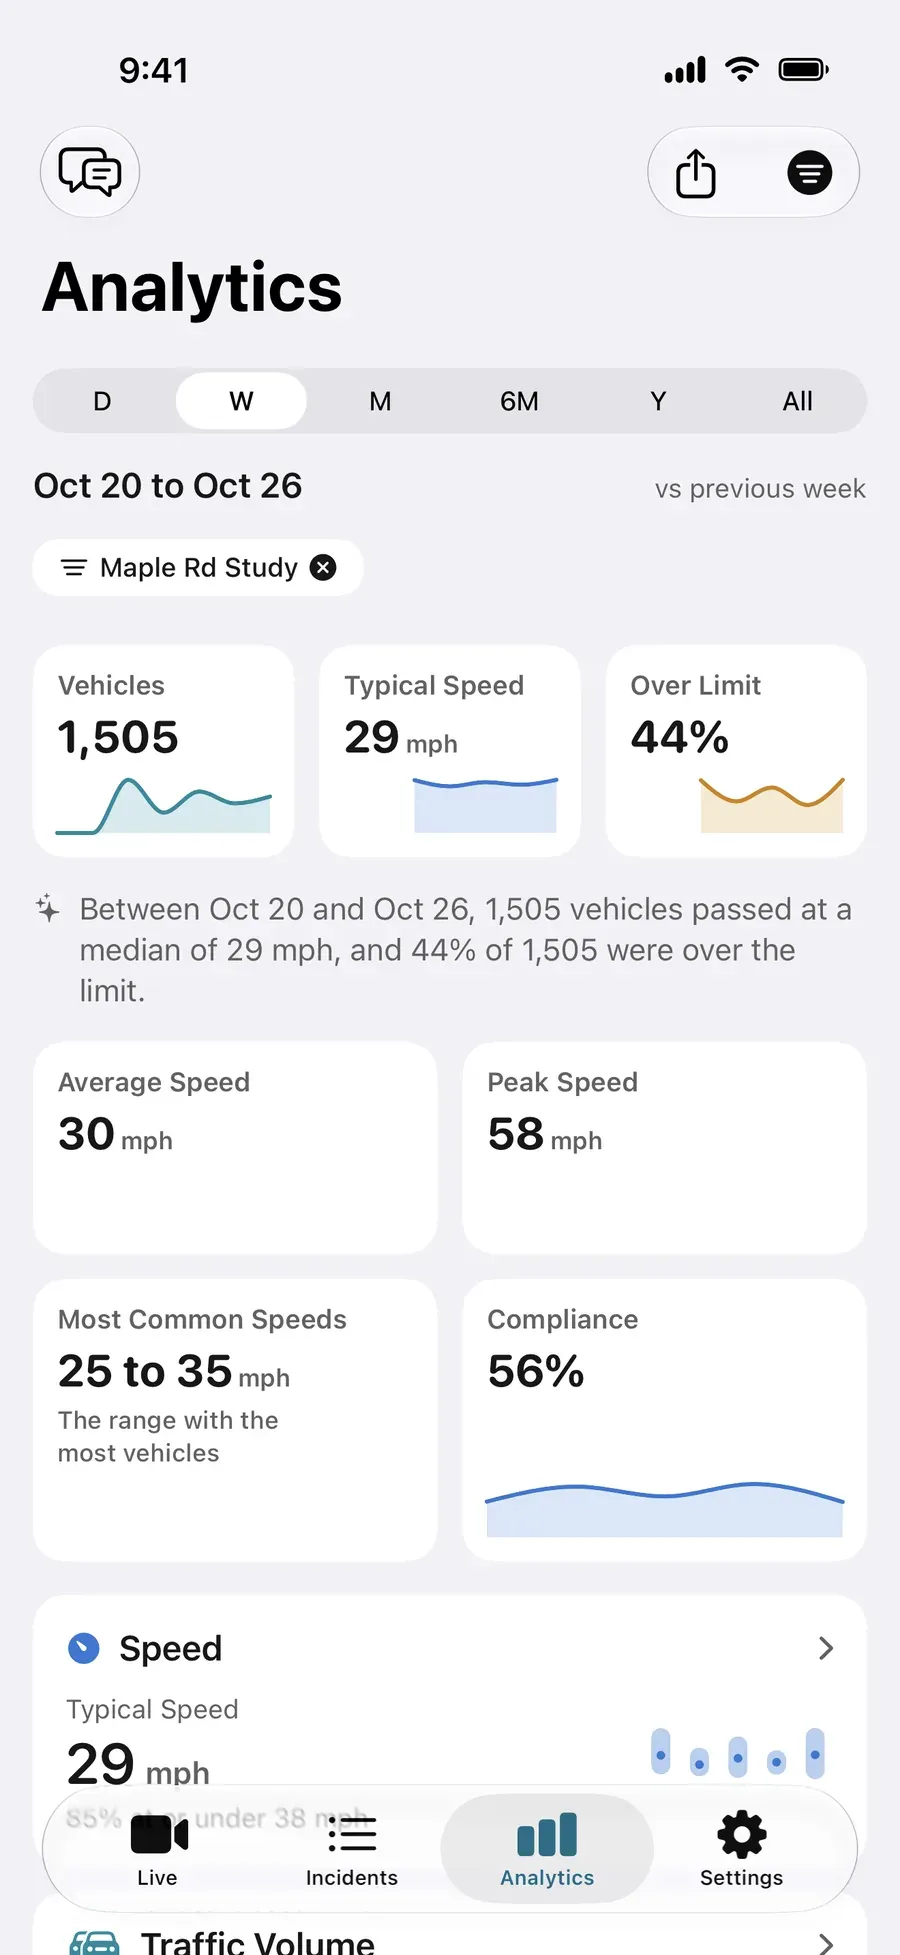
Choose the period at the top (day, week, month and longer), or one campaign from the filter, and read the first row:
- Vehicles: how many were measured in that period.
- Typical Speed: the median, the speed half the traffic stays at or under.
- Over Limit: the share of measured vehicles over the limit you set.
Under them, one sentence says the same thing in words. The Speed card adds the speed 85% of traffic stays at or under, and Compliance shows the share at or under the limit over time. Without Pro, the three figures head the Locked card, with the 85th percentile beside them, and Pro opens the sentence and the cards below.
5. See the cars over your limit
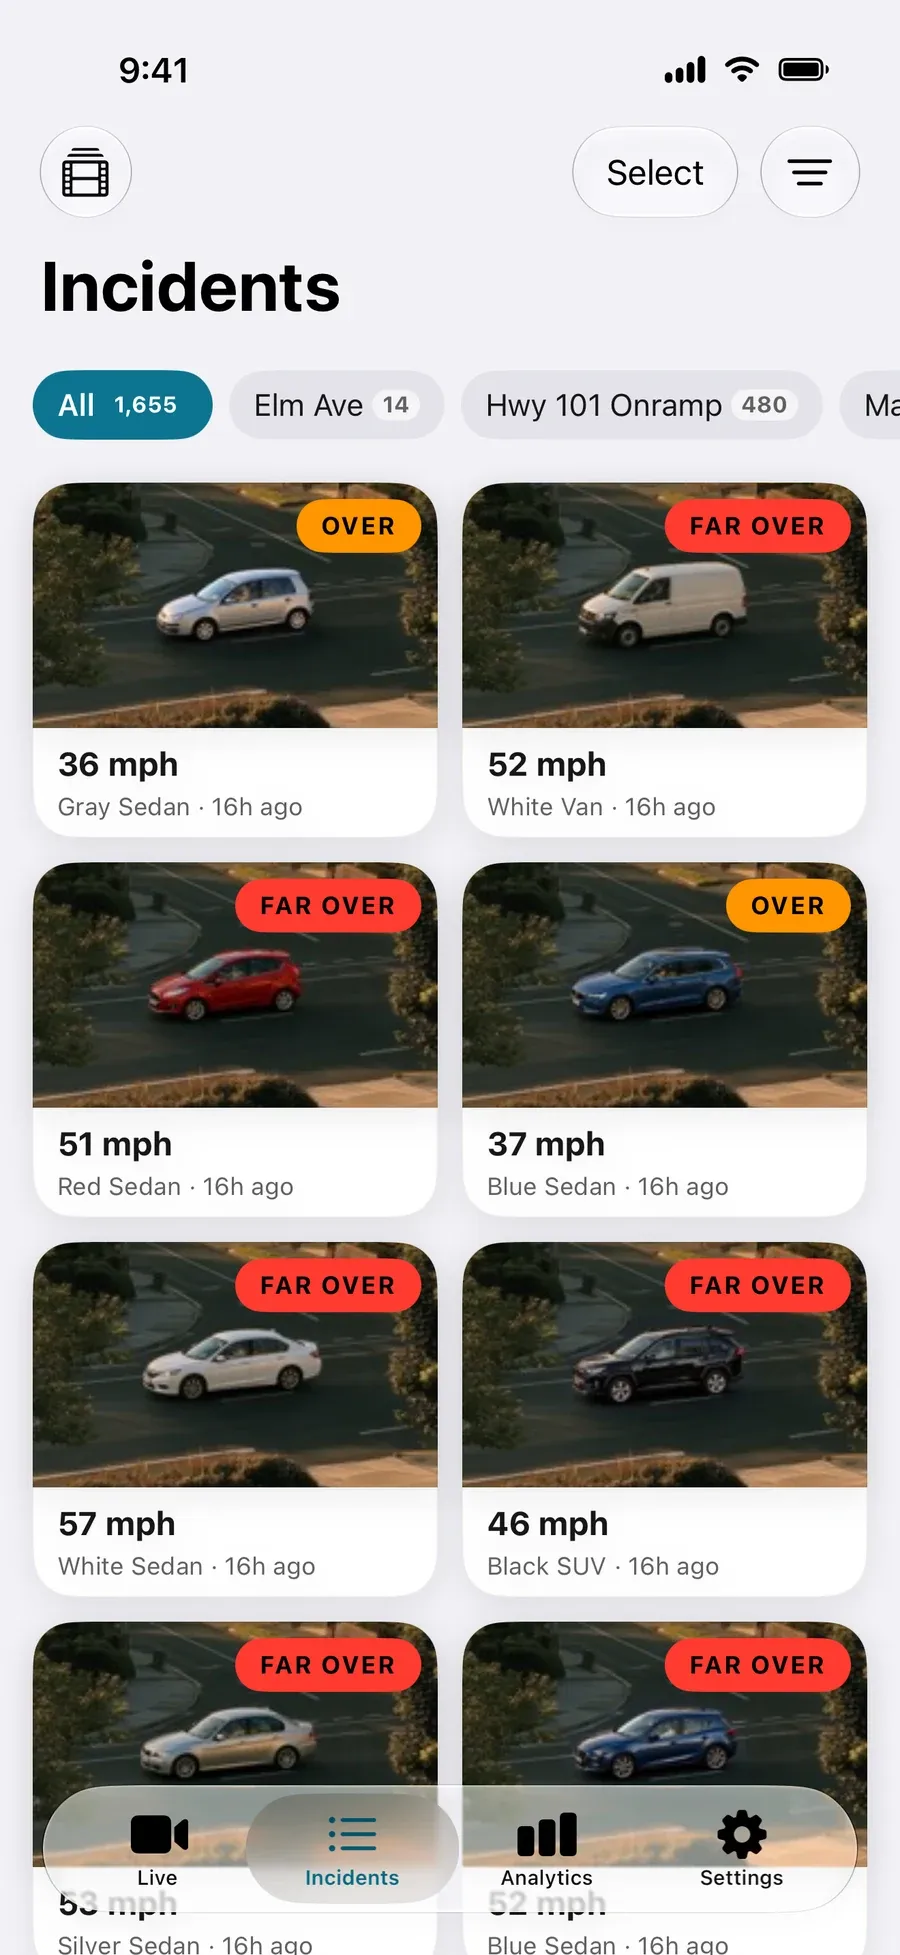
Each car over your limit by the margin you choose is saved as an incident, with photos, its speed and the time. The chips across the top filter the grid to one session. Without Pro, each card shows its photo and speed with a lock, and a tap offers Pro. With Pro, tapping a card shows every photo of that incident, and with Record Video chosen in the New Session sheet, incidents keep a short clip too.
6. Find the worst hours on the When screen
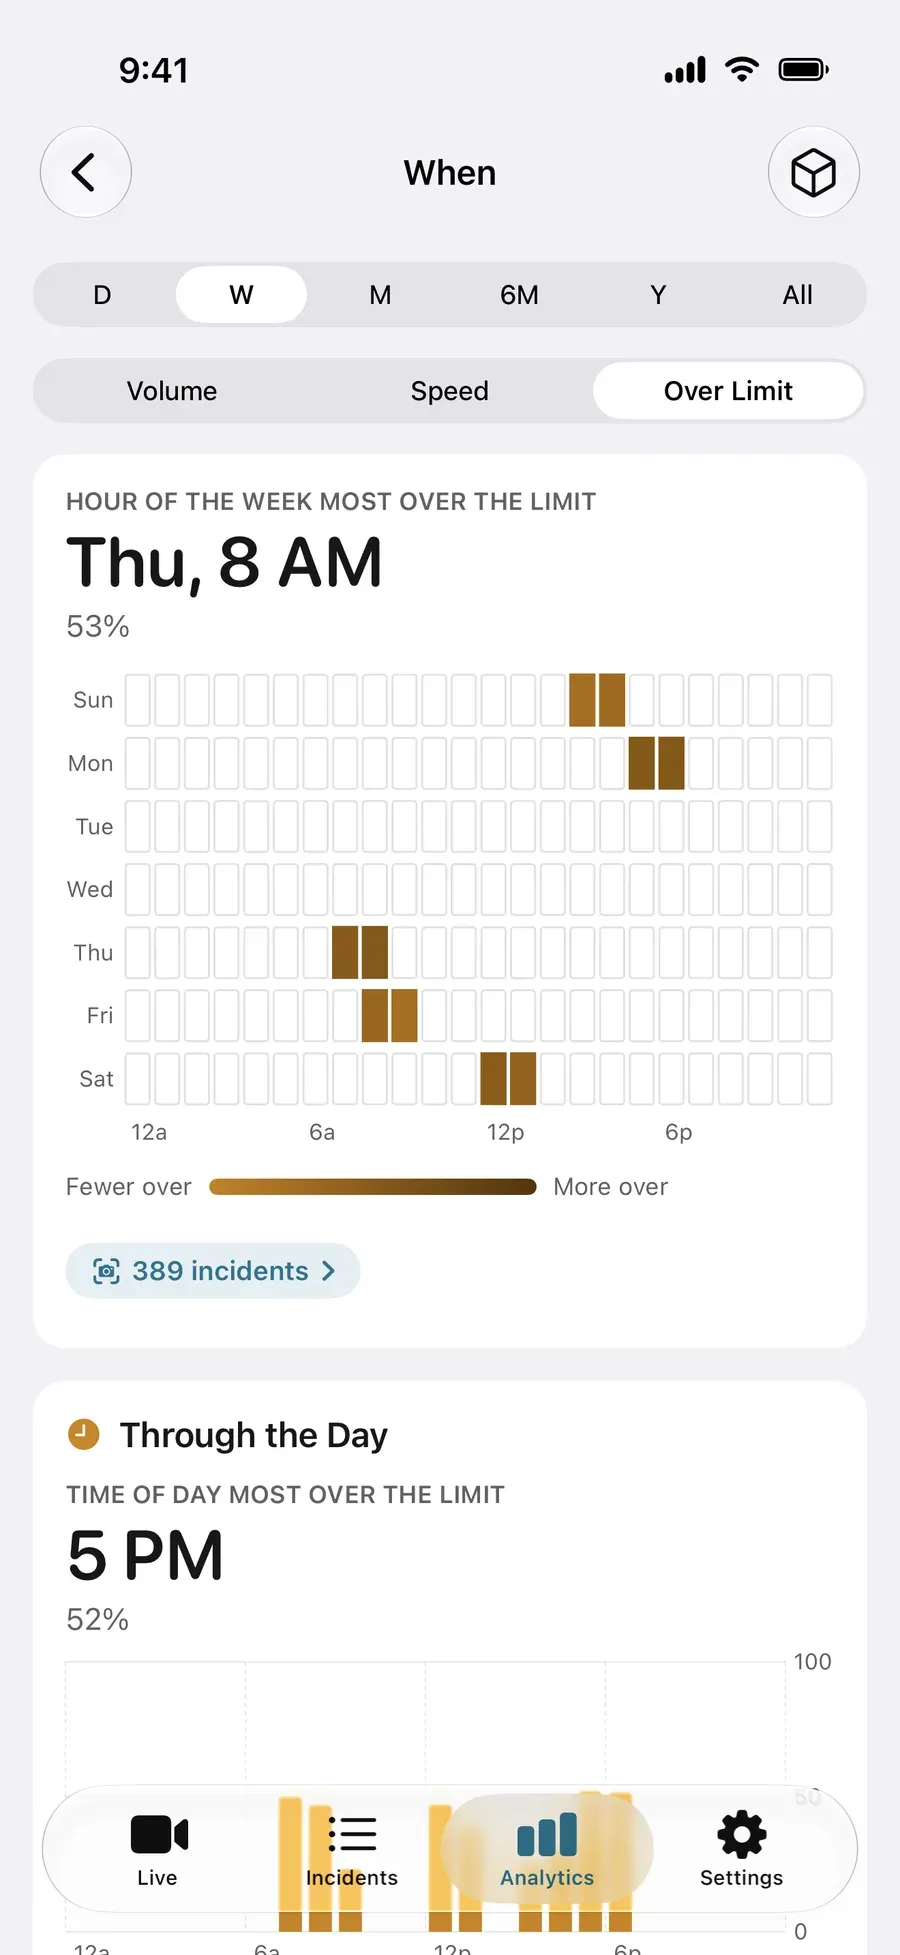
Open Analytics › When. It starts on Volume, the busiest hour of the week. Switch the grid to Over Limit and each cell shows the share of vehicles over your limit in that hour, so the hours with the highest share of vehicles over the limit stand out; Speed shows when the typical speed is highest. The busiest hour and the fastest hour are often not the same. There is more on this screen in When is my street busiest?
To keep or share what you found, export a PDF report with the charts and the incident table from the same tab, or the numbers as CSV.
What it is
It is your own count of your own street: how many vehicles passed, how fast and when, measured on your iPhone. Vehicles are detected on the phone, and your recordings are never sent to us.
Next steps
- What does it take to get a speed hump on your street?
- What is the 85th percentile speed, and how to work it out for your street
- Measure the speed of passing cars with your iPhone
- When is my street busiest?
- How to run a neighborhood traffic study or traffic survey with your iPhone
- SpeedCam AI for UK 20mph streets, for roads in the UK
- Pricing: what is free and what Pro adds
Questions, answered.
How can I tell if cars are speeding on my street?
Set an iPhone in a window or on a tripod, looking across the road, and record with SpeedCam AI for an hour or two on two or three days. The Analytics tab then shows how many vehicles passed, their typical speed and the share over the limit you set. Live speeds and recording are free, and so are those three numbers. Pro opens the charts and each car’s photos.
Is speeding in my neighborhood as bad as it seems?
A few loud, fast cars are easy to remember and hard to count. A recording counts all of them: Over Limit gives the share of measured vehicles over your limit, and the Speed card gives the speed 85% of traffic stays at or under. Compare two evenings and a weekend, and you know whether the pattern holds.
Which hours are the worst?
With Pro, open Analytics › When and switch the grid to Over Limit. Each cell is an hour of the week, shaded by the share of vehicles that went over your limit in that hour.
Does it save a photo of every car over the limit?
Yes. The cars over your limit by the margin you choose (5 mph over by default, or any speeding) are saved as incidents, with photos, once the status reads Measuring. Without Pro, each shows in the Incidents tab with its photo, its speed and a lock, and Pro opens it with all its photos. Every measured vehicle still counts towards the share over the limit.
Do I need Pro?
Not to record. Live speeds are free, with no time limit and no account, and every session is kept on your iPhone, locked. You see its vehicle count, typical speed and share over the limit, and each recorded incident with its photo. Pro shows every photo of each incident, the charts of your own street and the PDF report. Annual starts with a 3-day free trial for new subscribers, or choose Lifetime, one payment. Load Demo Data on an empty Analytics screen shows every chart first. See Is SpeedCam AI free?