
What is the 85th percentile speed, and how to work it out for your street
Line up the cars from slowest to fastest, count 85% of the way along, and read that car’s speed. A calculator does it for any list you paste.
The 85th percentile speed is the speed at or below which 85% of vehicles travel. Line up the cars that passed from slowest to fastest, count 85% of the way along the line, and the speed of the car you land on is the 85th percentile. No more than 15% of the cars went faster.
Traffic engineers use it to describe how fast a road is driven, and for decades it was the starting point for US speed limits. This page explains it, shows what changed in 2023, and works it out for any list of speeds you paste.
A 20-car example
Twenty cars pass on a 25 mph street. Sorted from slowest to fastest, their speeds in mph are:
18, 20, 21, 22, 23, 23, 24, 24, 25, 25, 26, 26, 27, 27, 28, 29, 31, 32, 34, 38
85% of 20 is 17, so the 85th percentile is the 17th speed: 31 mph. Seventeen cars went 31 mph or slower, and three went faster. The median, the middle of the list, is 25.5 mph, halfway between the 10th car (25) and the 11th (26). Ten of the twenty, 50%, were over the 25 mph limit.
Work it out for your street
Paste your own speeds below, one per line or separated by spaces or commas, and set your street’s limit. The calculator gives the 85th percentile, the median and the share over the limit, and draws the speeds in 5 mph ranges.
One per line, or separated by spaces, commas or semicolons. For decimals use a point, or a comma when the speeds are separated by spaces or new lines. Up to 300 mph or 500 km/h.
- 85th percentile
- 31 mph the 17th of 20 speeds, counted from the slowest
- Median
- 25.5 mph
- Over the limit
- 50% 10 of 20 over 25 mph
The calculator uses the nearest-rank method: sort the speeds, multiply their number by 0.85, round up to a whole number, and read the speed at that position. The answer is always one of the speeds you measured, never a value between two. It is the method SpeedCam AI’s Analytics uses, so a list pasted here gives the 85th percentile the app prints for the same speeds. A speed counts as over the limit when, rounded to a whole number, it is above the limit. Like the app, the calculator makes that comparison in mph, so a km/h list and its limit are converted to mph first. It takes speeds up to 300 mph, or 500 km/h.
Manuals differ on that last step. Texas’s speed zone manual takes 85% of 125 cars as the 106th car; rounding up, as the nearest-rank method does, gives the 107th. With a long list the two are one car apart, and both read a speed someone drove rather than one between two cars: the Texas manual says the 85th percentile is never interpolated.
Why engineers use it
The Federal Highway Administration explains that once a road is built, engineers evaluate how fast it is driven, often by measuring “the speed that 85 percent of drivers are travelling at or below.” The idea rests on the premise that most drivers choose a reasonable speed for the road and the conditions.
State manuals turn it into a limit:
- Texas. TxDOT’s Procedures for Establishing Speed Zones bases limits primarily on the 85th percentile: the limit is normally the nearest value ending in 5 or 0, and may be lowered or raised by up to 5 mph on the engineer’s judgment, or further under the conditions the manual lists. Its speed checks count at least 125 free-flowing cars in each direction, on average weekdays off peak, in good weather.
- California. Caltrans rounds the 85th percentile to the nearest 5 mph to set the limit, and an engineer can lower it by 5 mph for conditions a driver would not readily see, documented in the engineering and traffic survey. AB 43, passed in 2021, added a further 5 mph reduction where the survey finds the limit still more than is reasonable or safe and the road is a designated safety corridor, or runs beside places that draw many people walking or cycling, especially vulnerable groups such as children, seniors and people with disabilities. A city or county makes it by ordinance, and since AB 1014 took effect in 2026, Caltrans can too.
“Free-flowing” matters: a speed study counts cars whose drivers choose their own speed, so in a line of cars only the first is counted.
What changed in 2023
The 11th edition of the federal Manual on Uniform Traffic Control Devices (MUTCD), published in December 2023, rewrote the speed limit section (2B.21):
- The speed distribution, including the pace, the median and the 85th percentile, is one of six factors an engineering study should weigh, beside the roadway environment and characteristics, its context, the crash record and past speed studies.
- On urban and suburban arterials, and on rural arterials that serve as main streets, the 85th percentile should not be used to set a limit without considering all of those factors.
- On freeways, expressways and rural highways, the limit should be within 5 mph of the 85th percentile, when the other factors have been weighed and found not to call for anything else.
FHWA put it plainly in the final rule: there is no requirement that a speed limit be set at the 85th percentile speed.
See it for every session
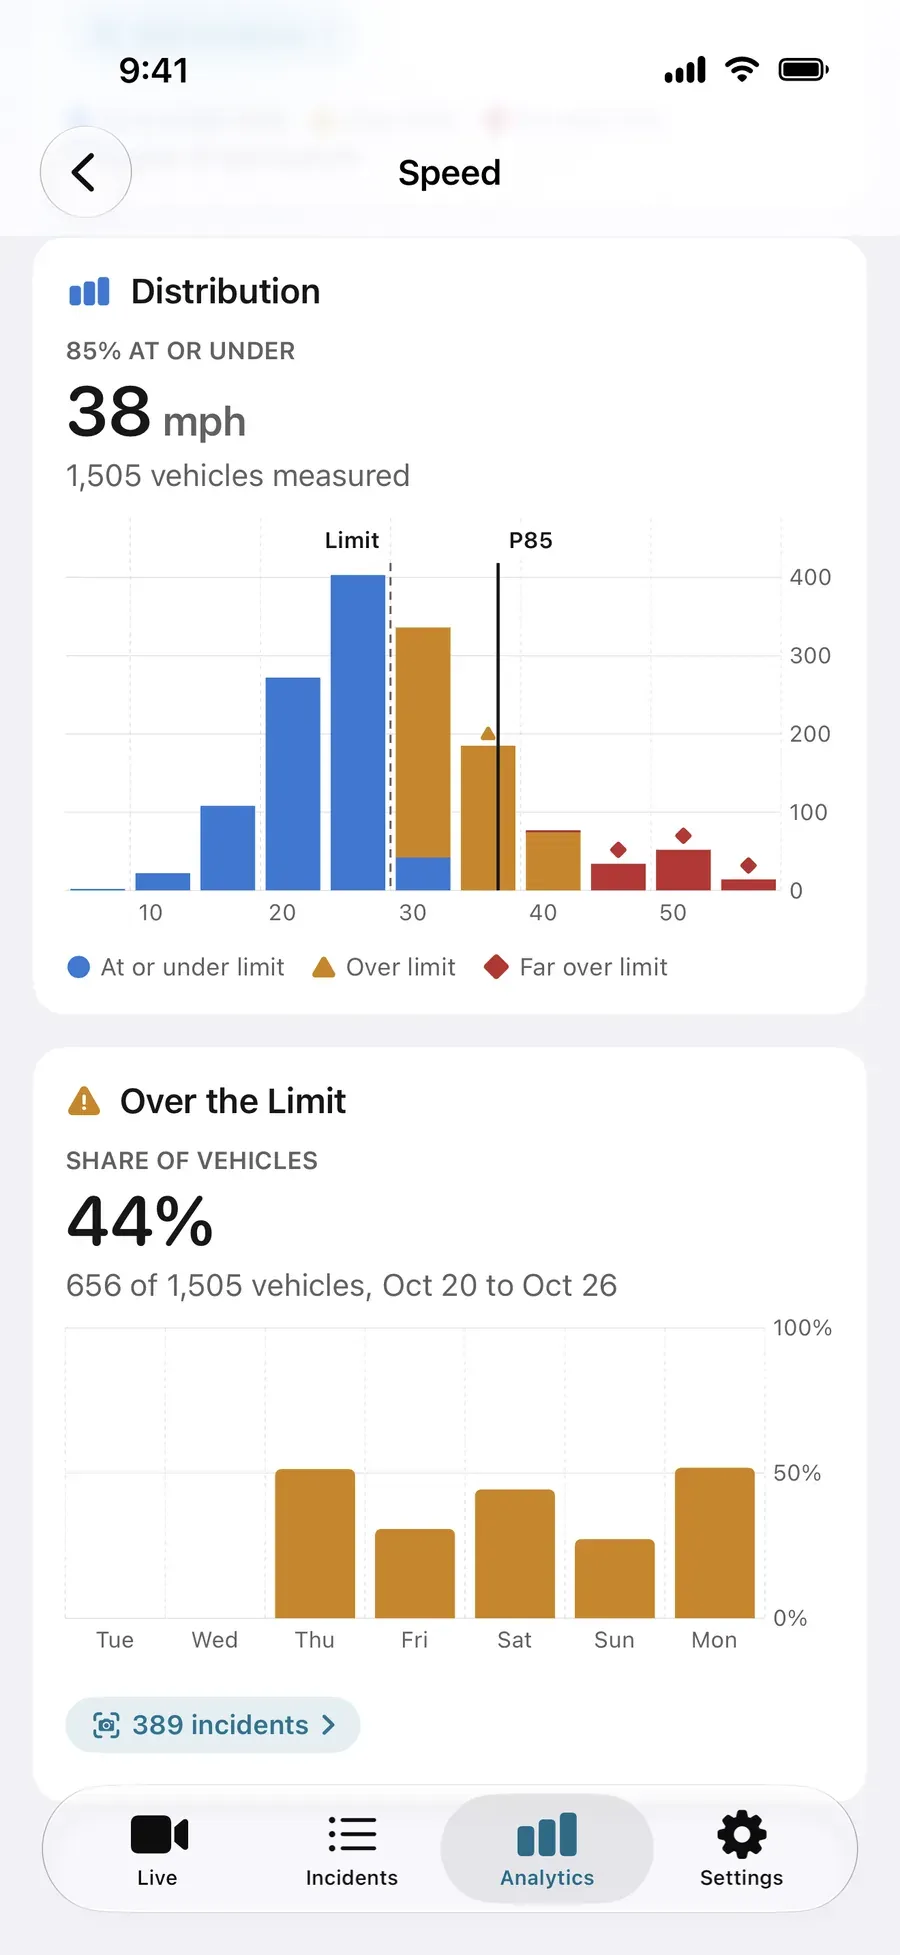
SpeedCam AI shows the 85th percentile and the share over the limit for every session you save. In Analytics, tap the Speed card for the period or session you choose, and scroll to Distribution: “85% at or under” and the speed, the bars with a dashed line at your limit and a line labelled P85, and below it Over the Limit, the share and how many vehicles that is. The overview’s first row shows the same share, and the PDF report lists both figures on its first page.
Recording is free. Without Pro, every session is kept on your iPhone, locked, and its 85th percentile and share over the limit show on the Locked card in Analytics. The Speed screen and the PDF report open with Pro. Annual starts with a 3-day free trial for new subscribers, or choose Lifetime, one payment, and Load Demo Data on an empty Analytics screen shows every chart before you subscribe.
Sources
Read on October 27, 2026.
- FHWA, Speed Concepts: Informational Guide, Chapter 2, Terminology and Notation: the definition.
- FHWA, Speed Limit Basics: how engineers measure it, and why it is not the only factor.
- FHWA, MUTCD 11th Edition, Chapter 2B, Section 2B.21, and the final rule in the Federal Register, December 19, 2023.
- TxDOT, Procedures for Establishing Speed Zones, Determining the 85th Percentile Speed and Variation from 85th Percentile.
- Caltrans, Setting Speed Limits; the California Legislature, AB 43, Traffic safety (2021), and Vehicle Code section 22358.7 as amended by AB 1014.
Next steps
Questions, answered.
What does 85th percentile speed mean?
It is the speed at or below which 85% of vehicles travel. If 100 cars pass, line them up from slowest to fastest: the 85th car’s speed is the 85th percentile, and no more than 15 cars went faster.
How do I calculate the 85th percentile speed?
Sort the speeds from slowest to fastest, multiply the number of speeds by 0.85, round up to a whole number, and read the speed at that position. For 20 speeds, 20 × 0.85 = 17, so it is the 17th speed. This is the nearest-rank method, and the calculator on this page does it for any list you paste.
Why are speed limits set at the 85th percentile?
For decades, US speed zoning started from the idea that most drivers choose a reasonable speed, so engineers set limits near the 85th percentile of free-flowing traffic; Texas and California manuals still start there. Since the 2023 edition of the MUTCD, the speed distribution is one of six factors in an engineering study, and on urban and suburban arterials and rural main streets the 85th percentile should not set a limit on its own.
Is the 85th percentile the same as the average speed?
No. The average and the median describe the middle of the traffic. The 85th percentile describes the faster part: the speed no more than 15% go above, so it sits at or above the median.
Where does SpeedCam AI show the 85th percentile?
In Analytics, the Speed card reads “85% at or under” for the period or session you choose, and the PDF report lists the 85th percentile on its first page. Recording is free, and without Pro the 85th percentile of your sessions shows on the Locked card in Analytics. The Speed card and the PDF open with Pro, and Load Demo Data on an empty Analytics screen shows every chart first. See Pricing.