Skip to content
SpeedCam AI

20mph speed check for your street.

Is the traffic on your road, or through your village, doing 20? Prop up your iPhone in a window, looking across the road, and see each car’s speed in mph as it drives by. No radar gun, no extra kit, and your recordings are never sent to us.

  • No account
  • Recordings never sent to us
  • Live speeds free

Live speeds are free for as long as you like, and every session is kept on your iPhone. Pro opens its photos and the charts of your road, and adds video clips.

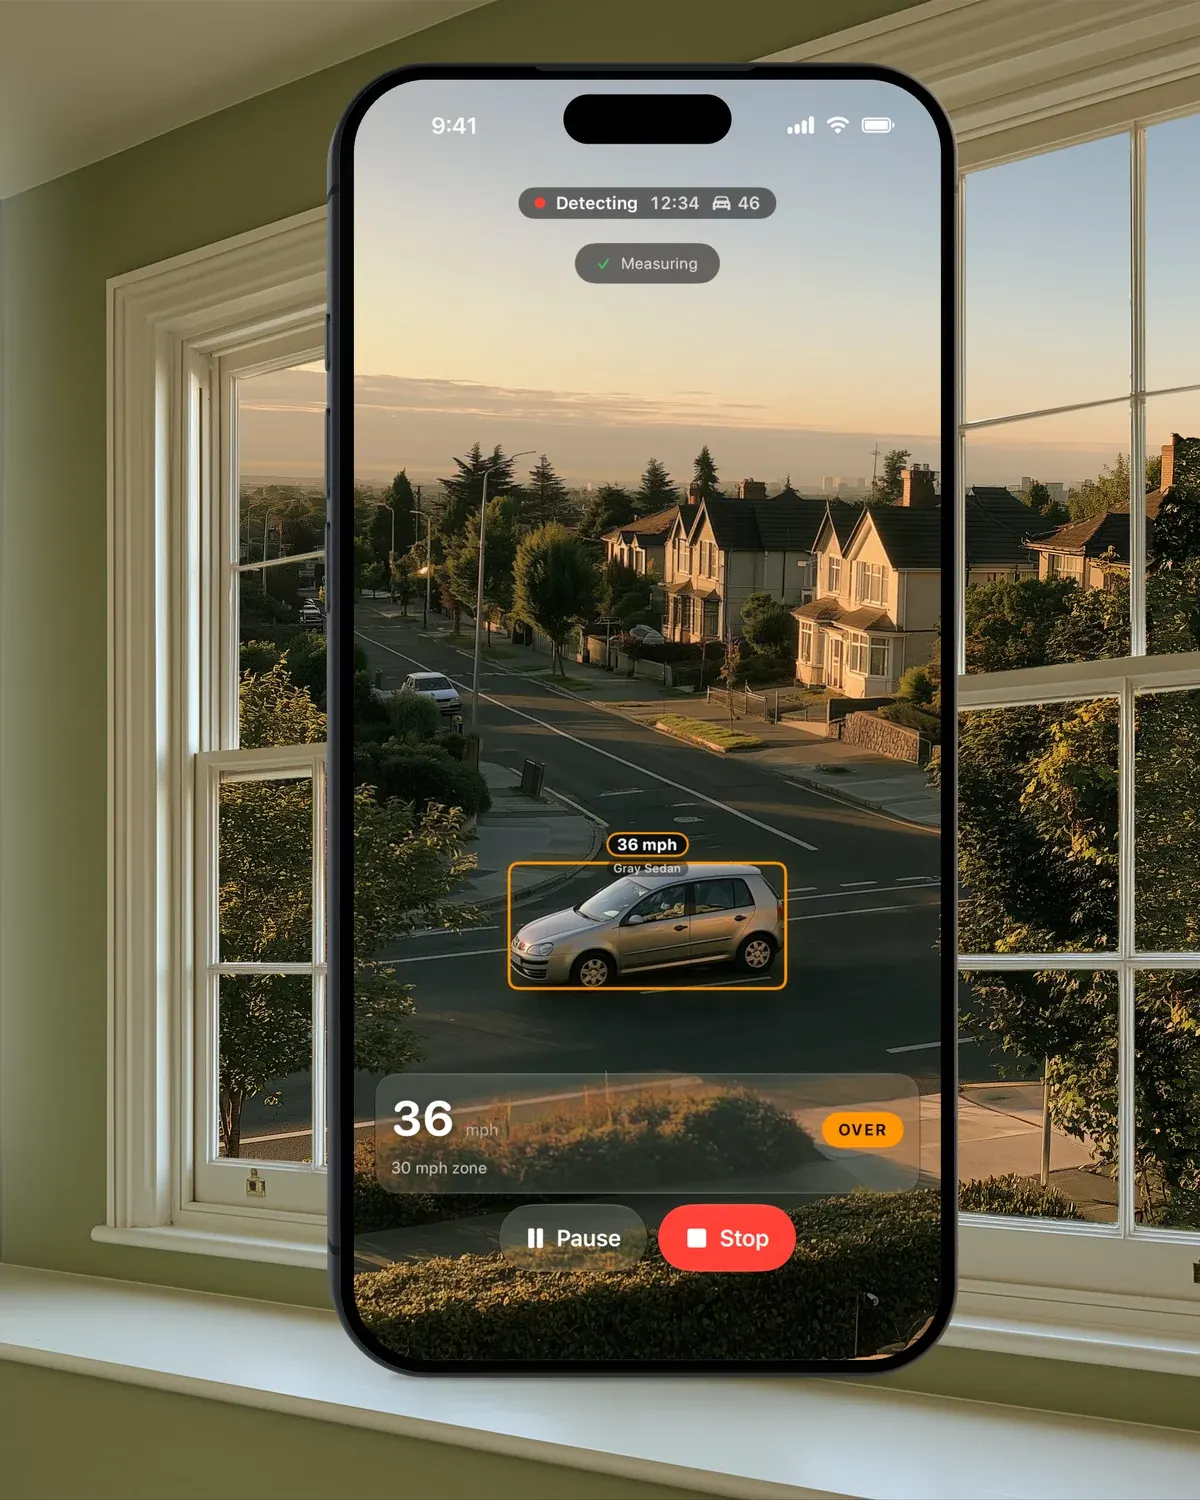
An iPhone on the windowsill of a sash window, looking across a British street, with SpeedCam AI showing a passing car at 36 mph

Is traffic through your village doing 20?

A 20mph speed check in three steps

Set the limit to 20 mph

In Settings › Capture › Speed Limit, or in the New Session sheet when you start. The picker runs from 15 mph up, and speeds show in mph on a UK iPhone.

Put the phone in a window

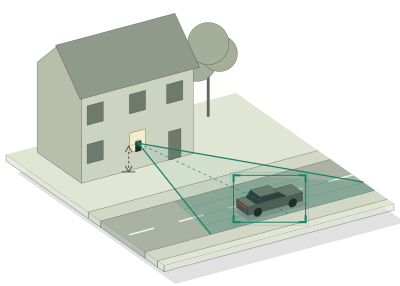
Looking across the road and turned a little to one side, close enough that a passing car fills a quarter of the picture’s width. For more accurate speeds, enter how high it sits above the road in Settings › Capture › Camera height.

Tap Start

Start Detecting shows each car’s speed as it passes, free, and saves the session, every vehicle counted and the cars over your limit by the margin you choose saved with photos. Without Pro it is kept on your iPhone, locked, and Pro opens the charts below.

For UK roads

Made for 20mph zones and school streets

  • Speeds in mph, with your road’s limit set to 20 mph, 30 mph or whatever it is.
  • On a 20 mph zone or a school street, see how many vehicles go over the limit, and when (Pro).
  • See how busy your road gets on the school run, and how fast traffic passes the school gates (Pro).

Nothing to measure first: the app learns your view from the traffic going by. Point the camera across the road, turned a little to one side, leave it recording for an hour or two, and you have a measured spread of speeds instead of an impression.

Inside the app

The screens on the App Store

Live speeds, saved photos and clips, and charts of your road, in the British screens the UK store shows.

No radar gun, just your iPhone.

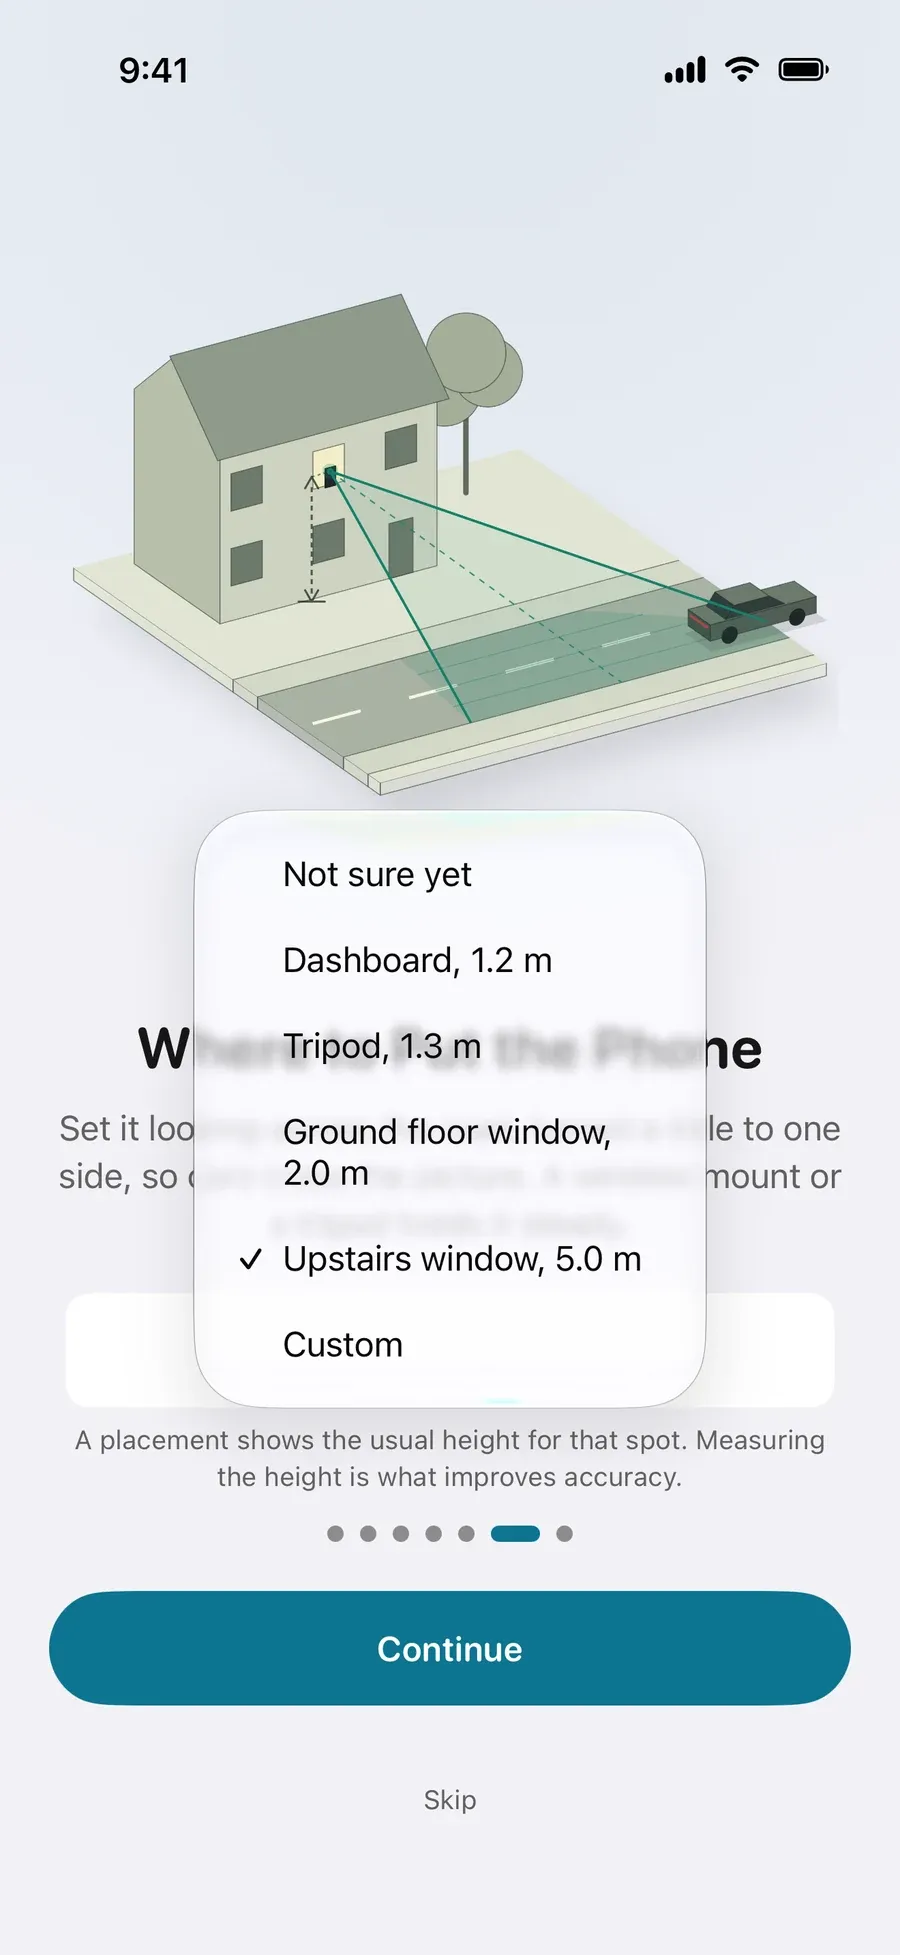
Stand it on a windowsill, a dashboard or a tripod, looking across the road and turned a little to one side. Tell the app where it sits, or enter its height above the road for more accurate speeds.
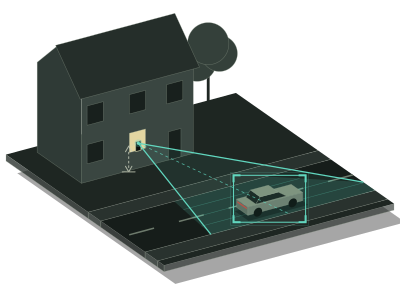
Speed gun for cars, or the iPhone in your window
The screen for placing the phone, with the menu of placements open, heights in metres

Over the limit, photo saved.

Set the limit to 20 mph and choose how far over it counts: any speeding, or 5, 10 or 15 mph over. Each vehicle past that is saved with photos, its speed and the time.
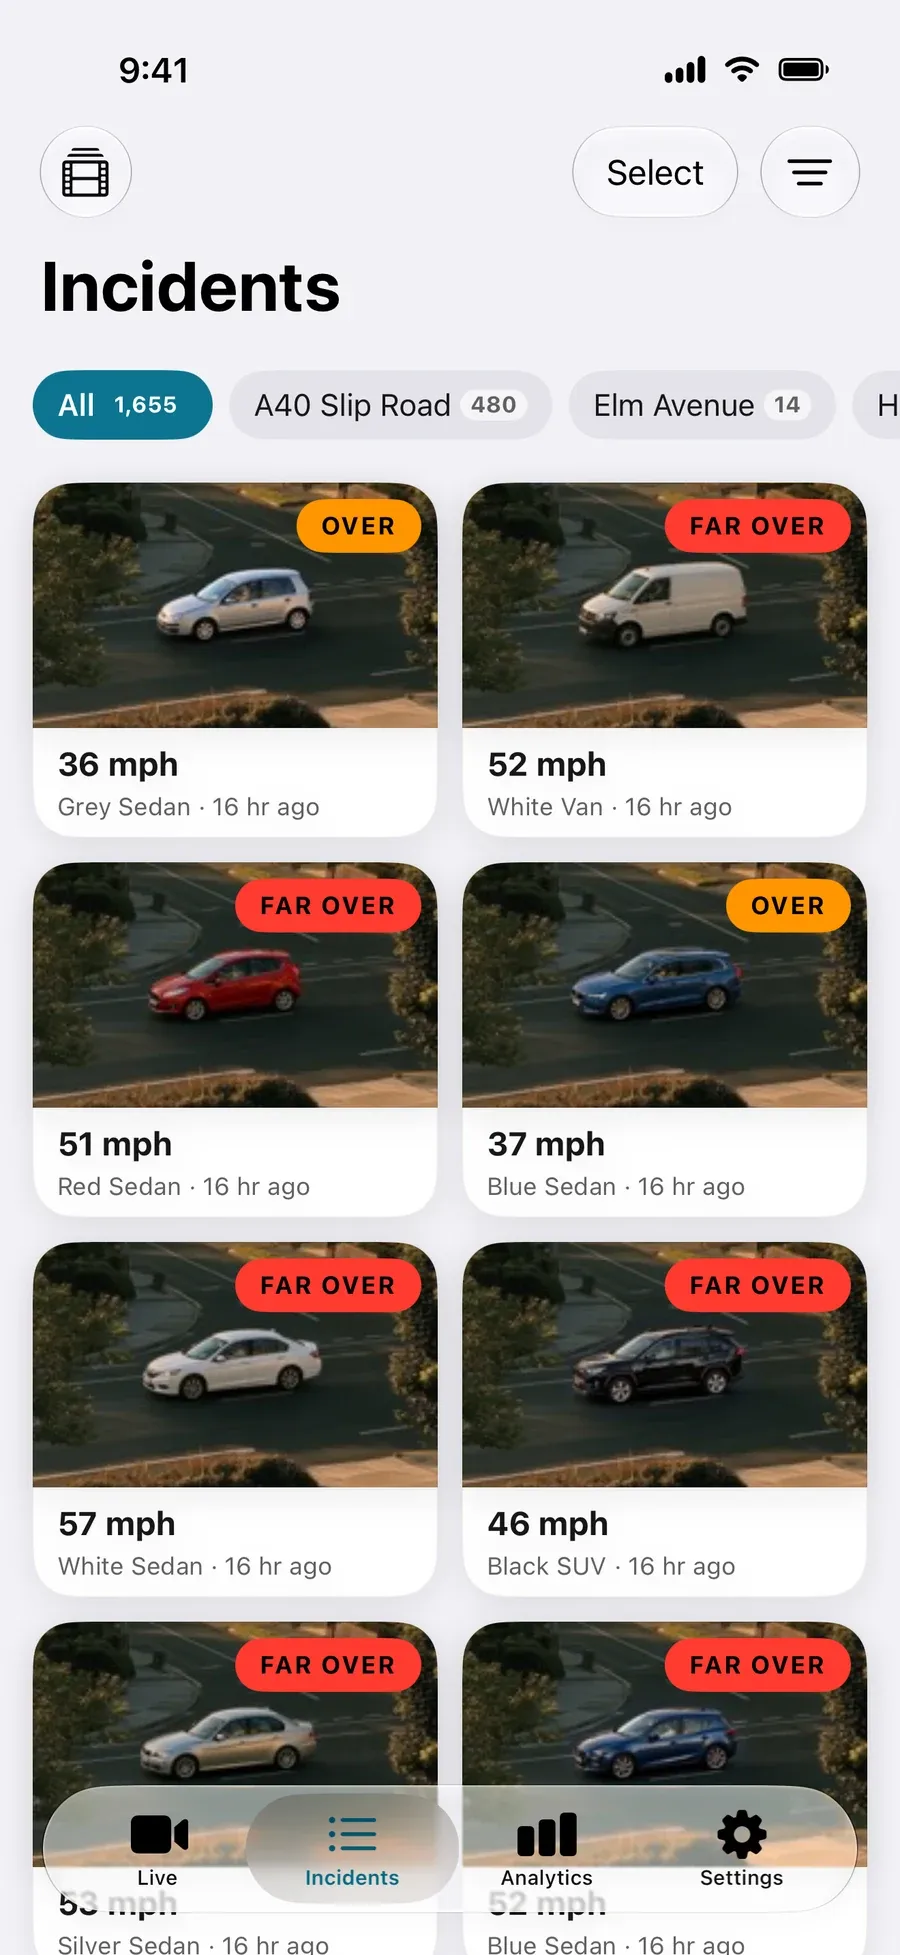
A grid of saved cars on a UK road, each with its speed in mph
Pro

How many cars go over the limit?

Is the traffic doing 20? A week of your road on one screen: how many vehicles, the typical speed, the share over the limit, and the speed 85% of traffic stays at or under. Tap a chart to open the incidents behind it.

Run your own speed survey of your road
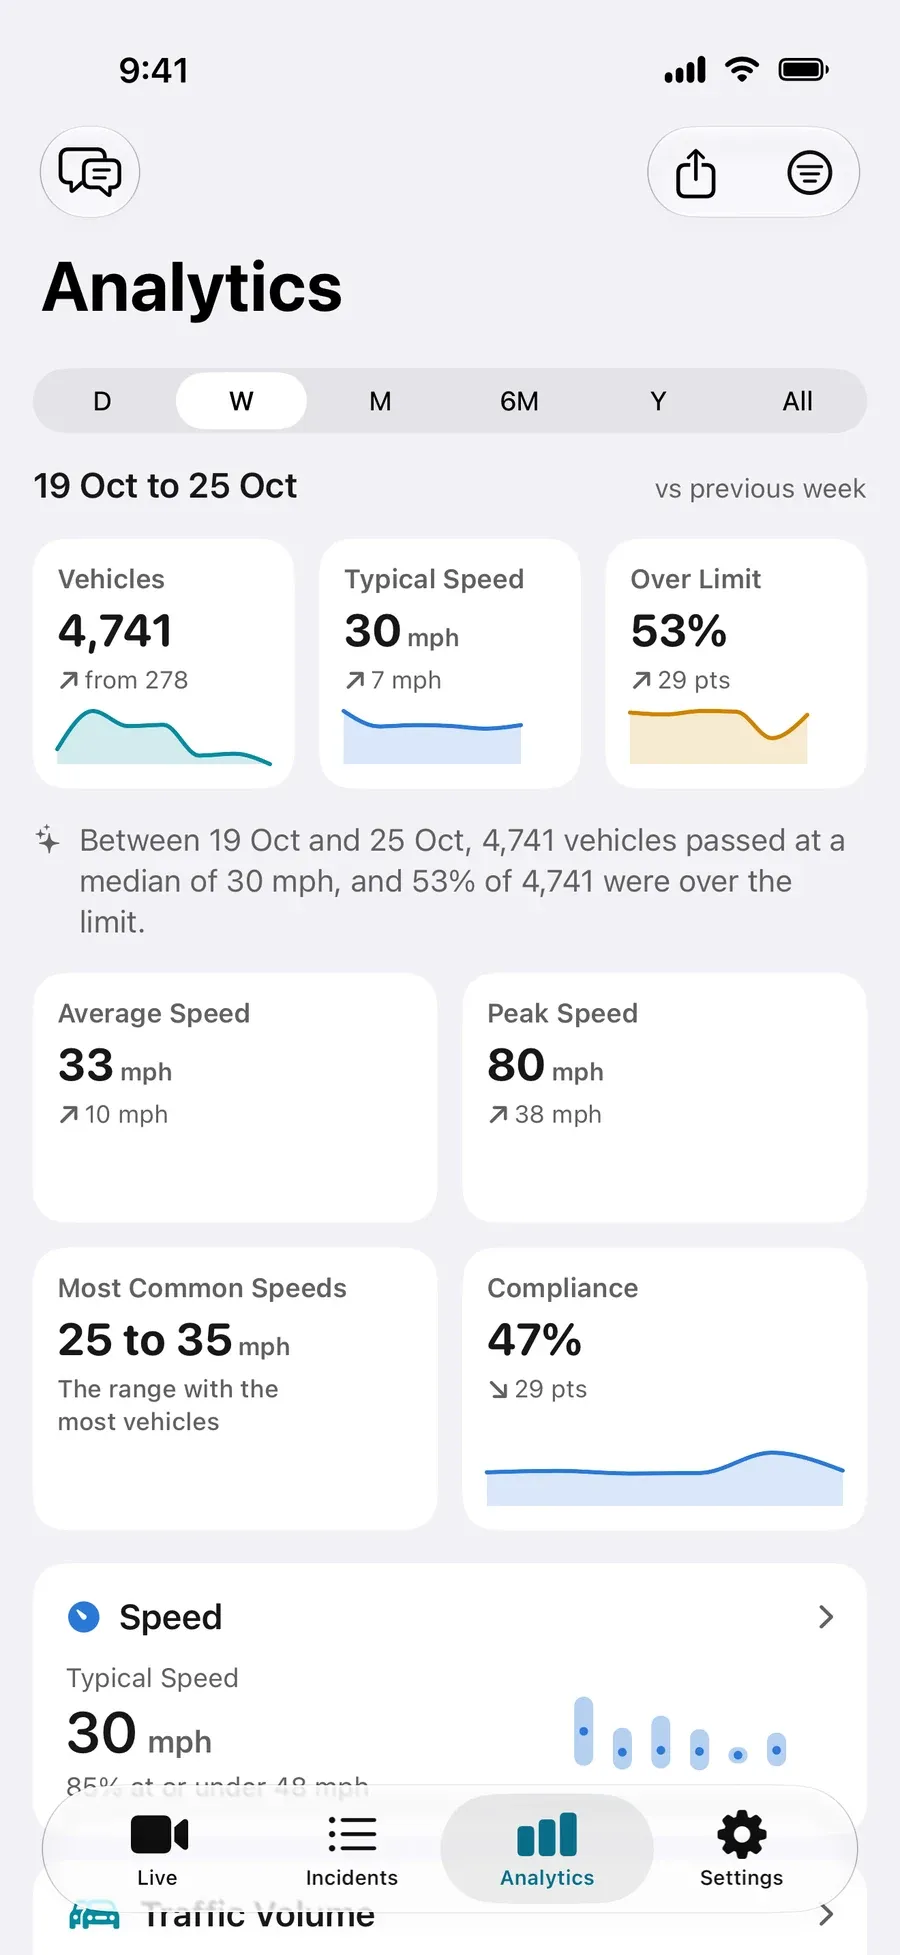
The Analytics screen for a week: vehicles, typical speed and the share over the limit
Pro

One car, its video and photos.

Open a saved car to see its photos, play its clip if you record video, and check its speed, the limit and the weather.
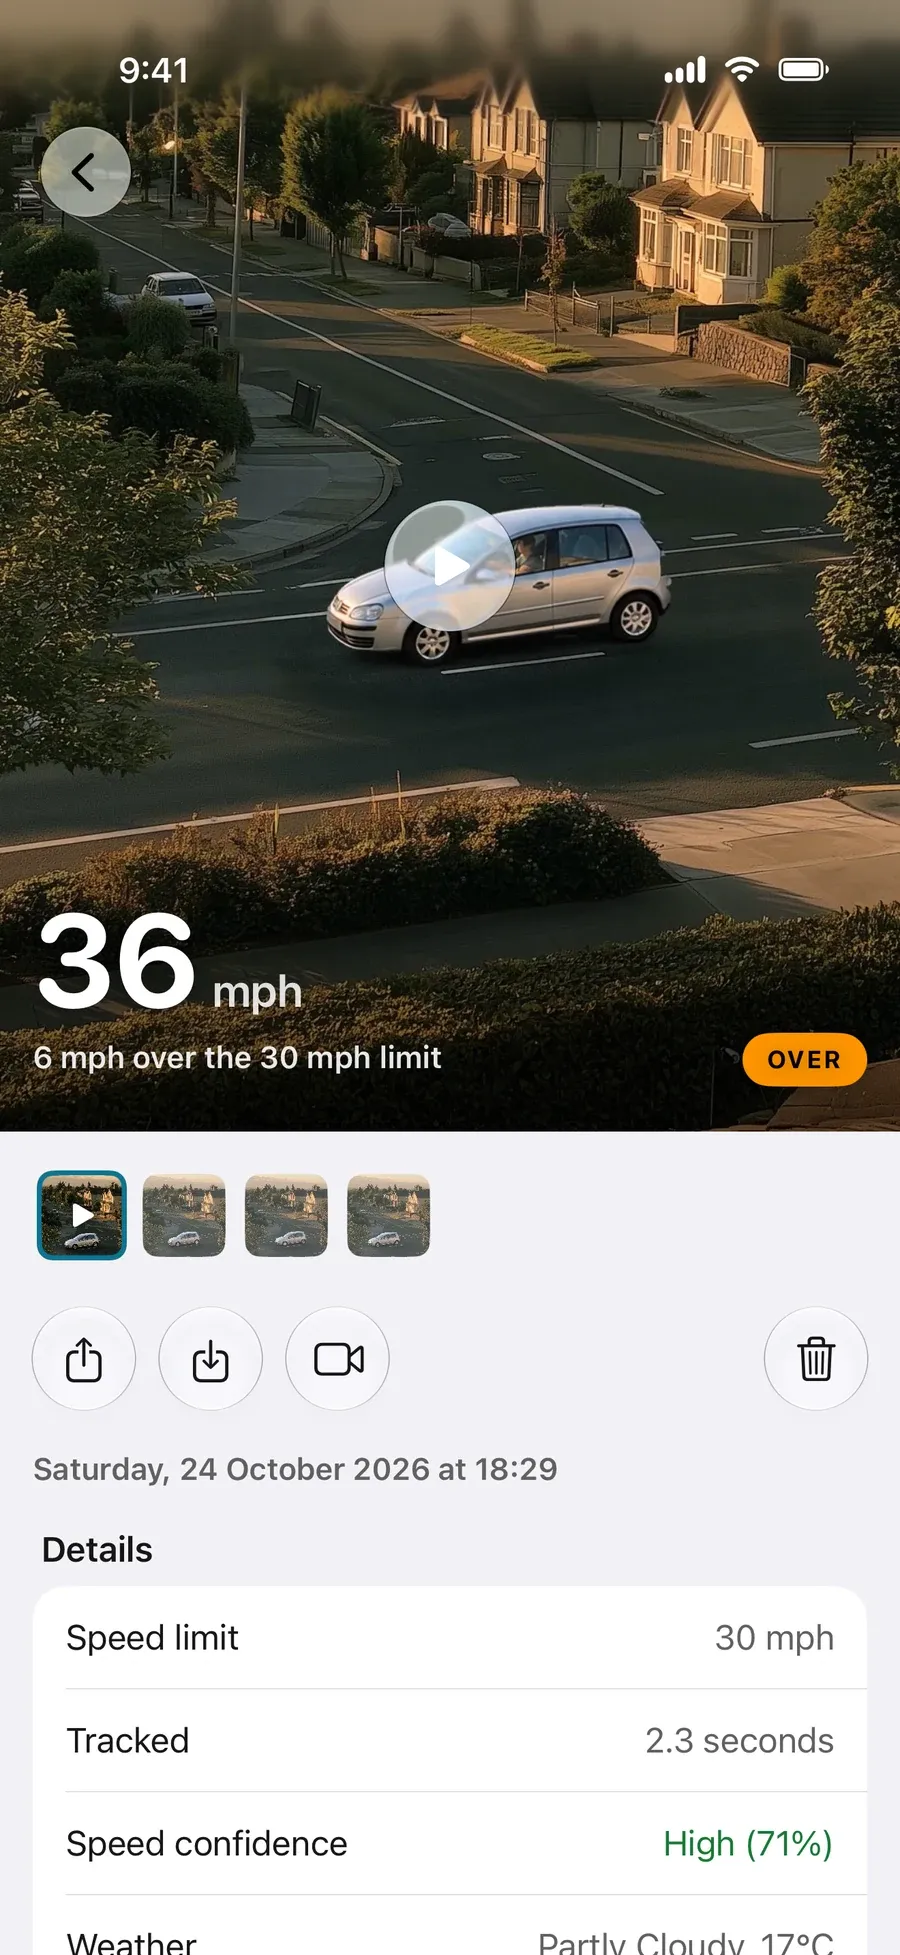
A saved car: its video clip, 6 mph over the 30 mph limit, and a row of photos
Pro

When is your street busiest?

See the school run hour by hour: which hours and days carry the most traffic, coloured by volume, speed or the share over the limit.

When is my street busiest?
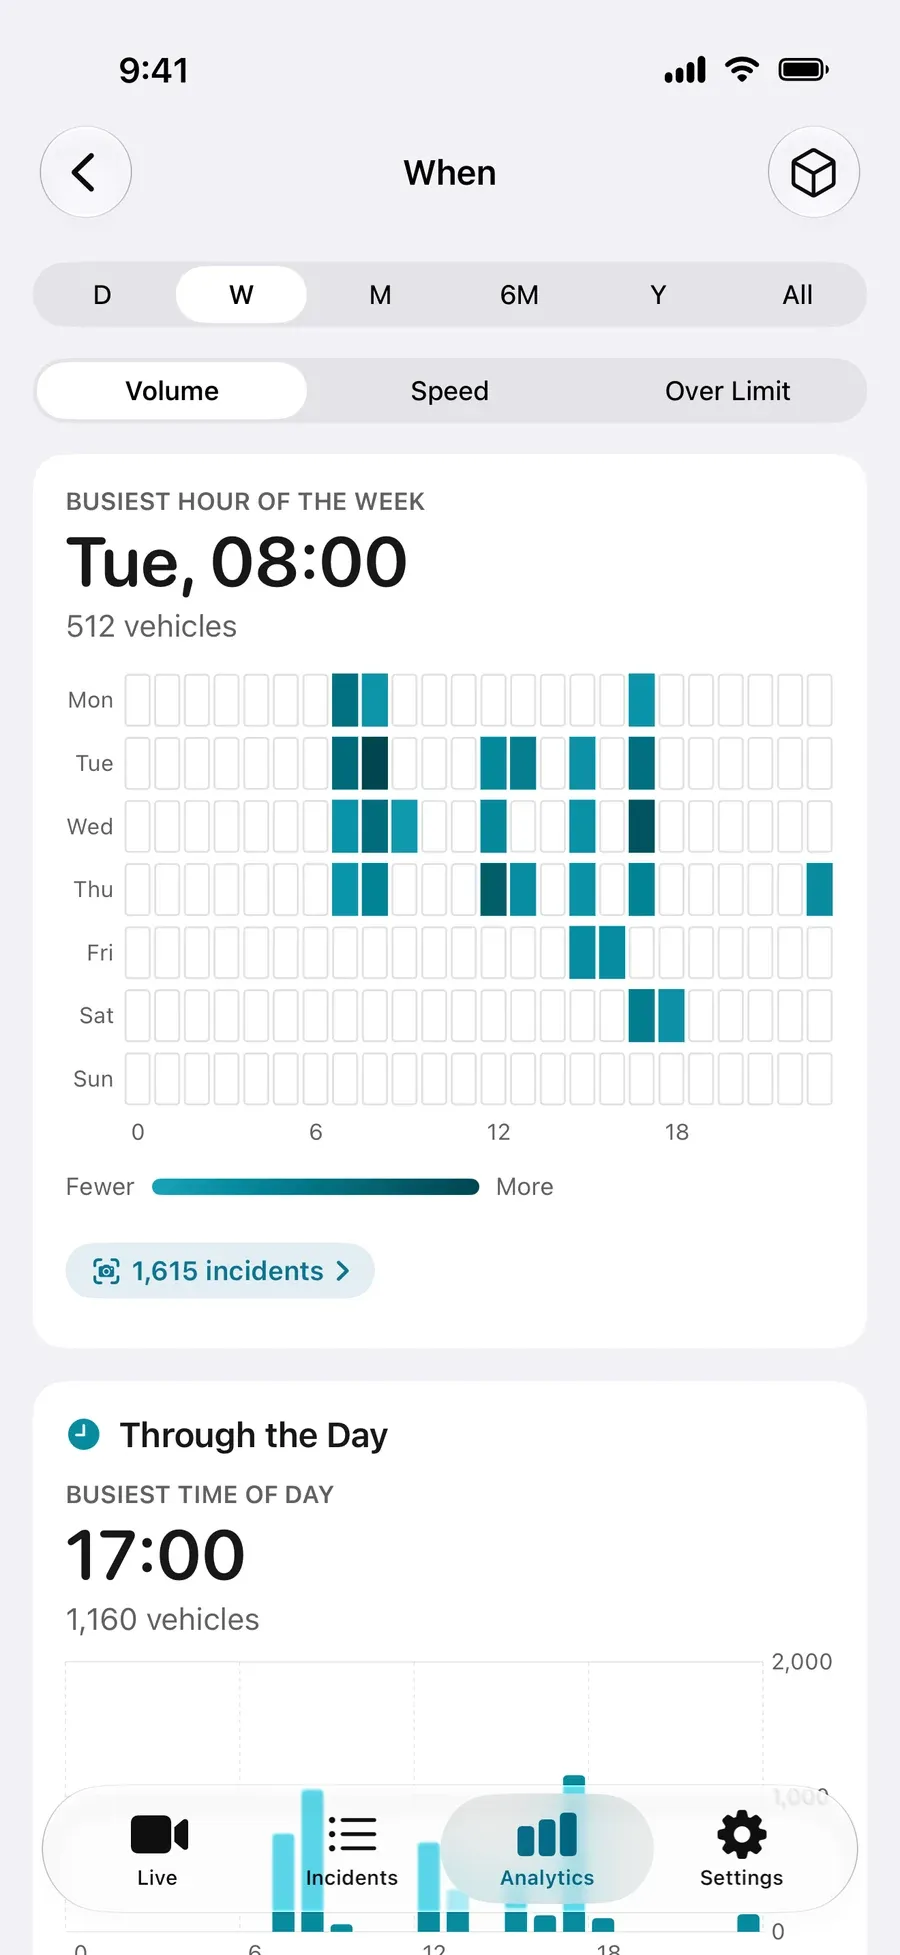
A grid of weekdays by hour, with the busiest hour of the week
Pro

Your street, ready to share.

Export a PDF report of your road, with its summary figures, the charts and the incident table, or the numbers as CSV and JSON.
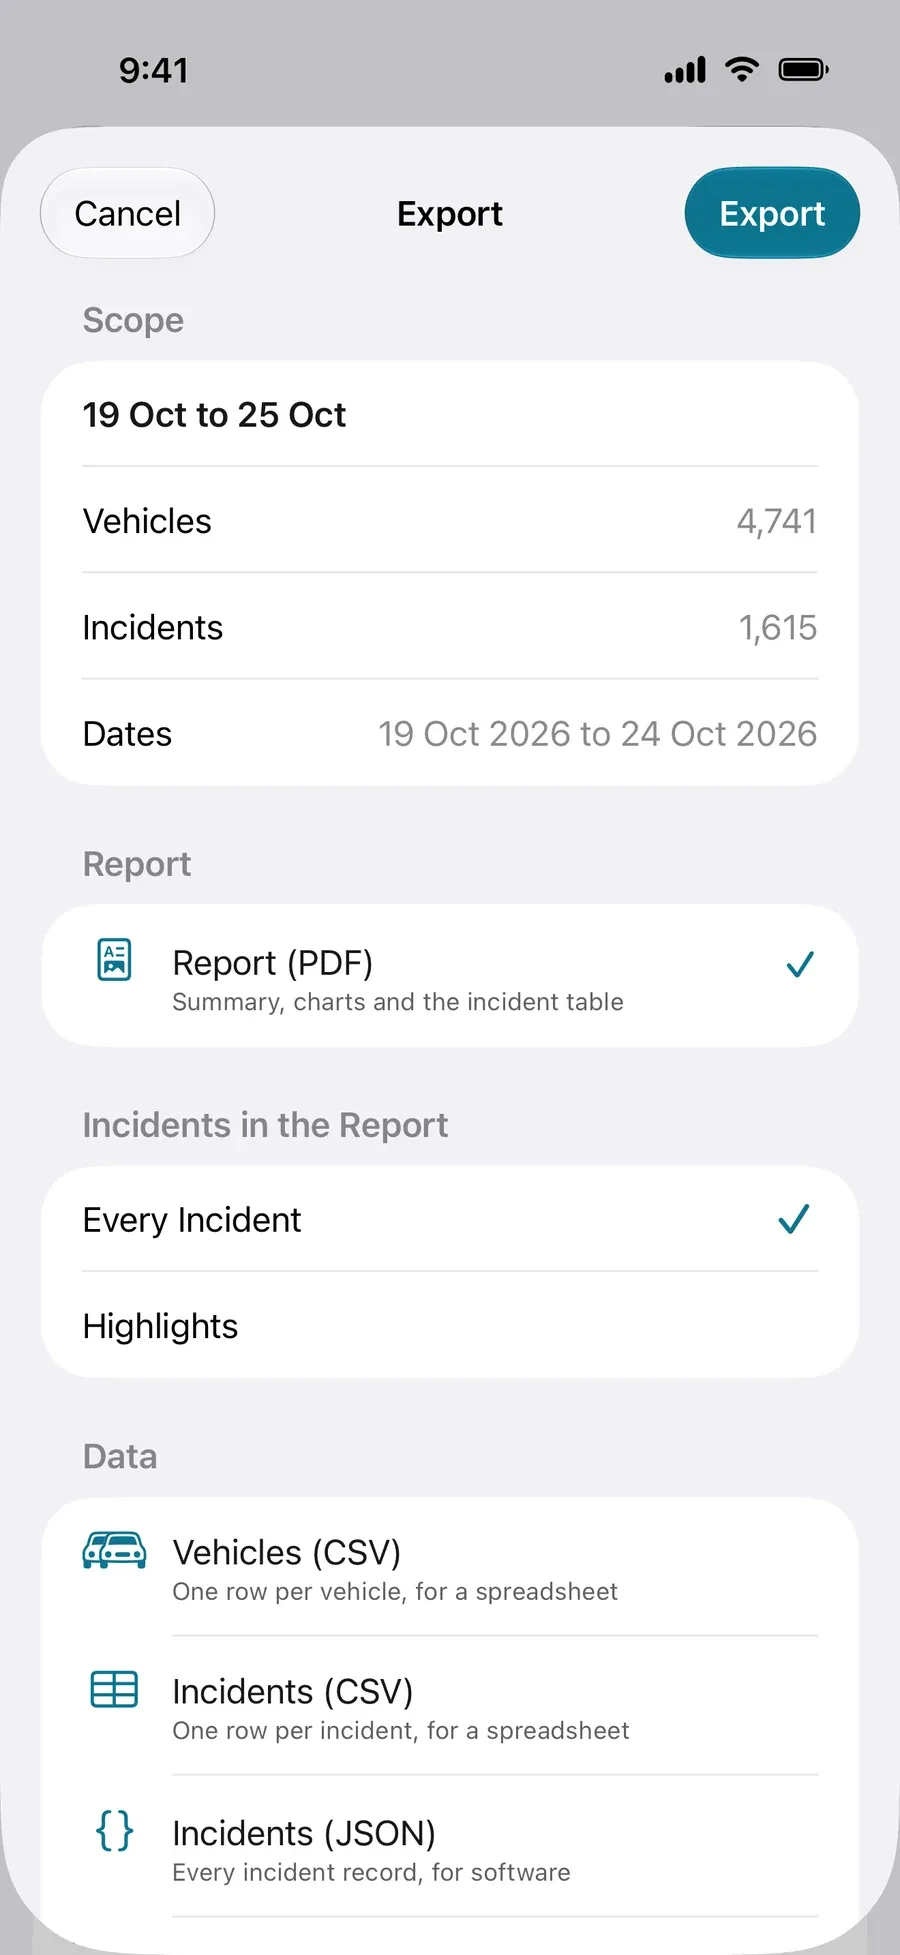
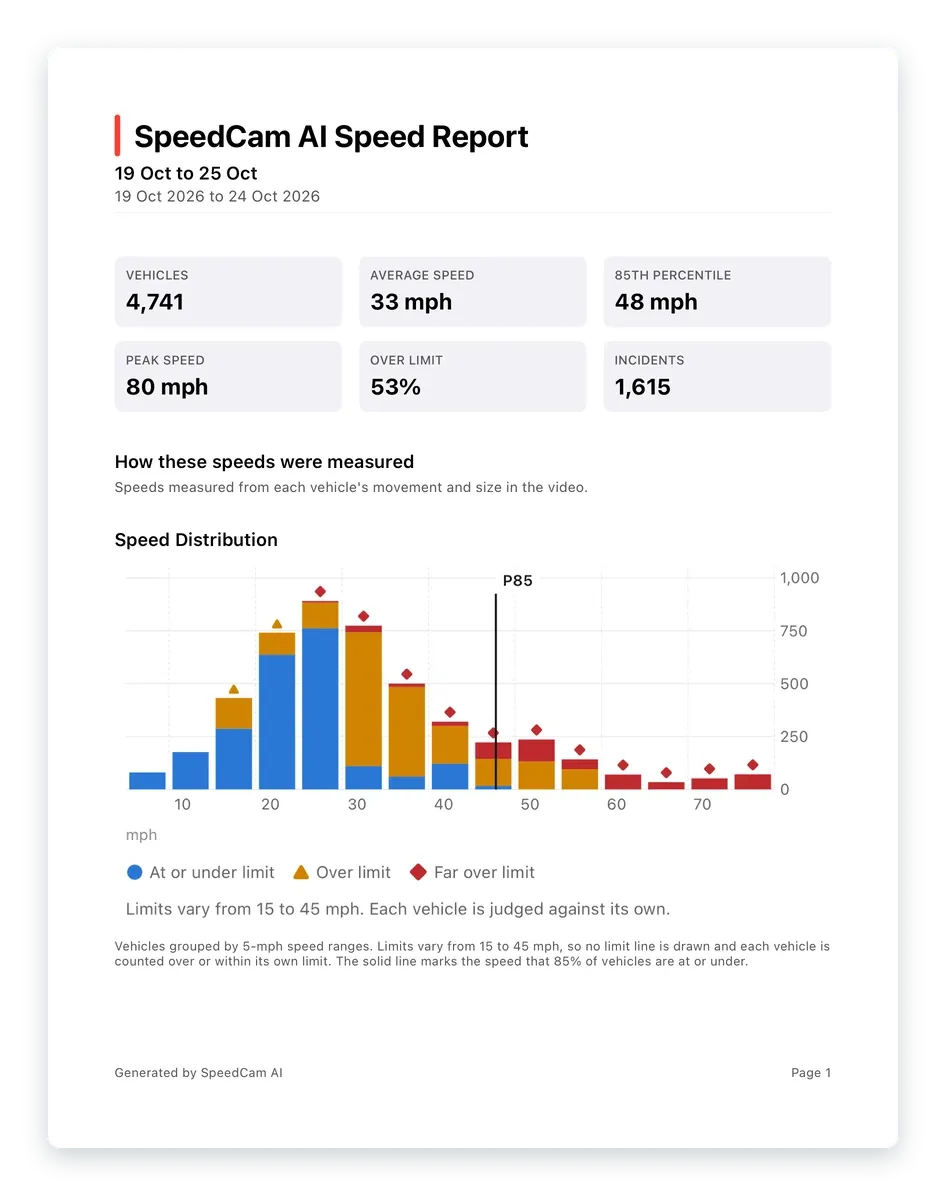
An iPhone on the Export screen with the PDF report selected, and the first page of the PDF report, with its speed figures, tilted over the iPhone’s lower corner

Before and after

See what changes on your road

When something changes on your road, a new limit, a school street or a road closure nearby, record it before and after. Give each set of sessions its own Campaign name in the New Session sheet, such as “Before” and “After”, and record the same hours on the same weekdays each time. Analytics shows one campaign at a time, with its own count, typical speed and share over the limit, so you can read one and then the other, with or without Pro. Pro adds the charts and a PDF of each. The steps are in did 20mph work on your road?

What you get

A speed survey, run from a windowsill

Every vehicle, not just the fast ones

Speeds for cars and motorbikes as they pass, and every lorry and bus counted too. With Pro, the charts add cyclists and people walking on the live camera. A quiet road with four bad minutes an hour looks very different once you can see the whole day.

The numbers that describe a road

The speed 85% of traffic stays at or under, the most common speeds, how many vehicles keep to the limit, and traffic by hour: the figures a speed survey reports, in charts you can read at a glance (Pro).

The same answer on three different days

Group sessions under one Campaign name, such as school mornings, and the charts roll them up (Pro). One afternoon tells you little. Three sessions across three days that agree with each other show whether the pattern holds.

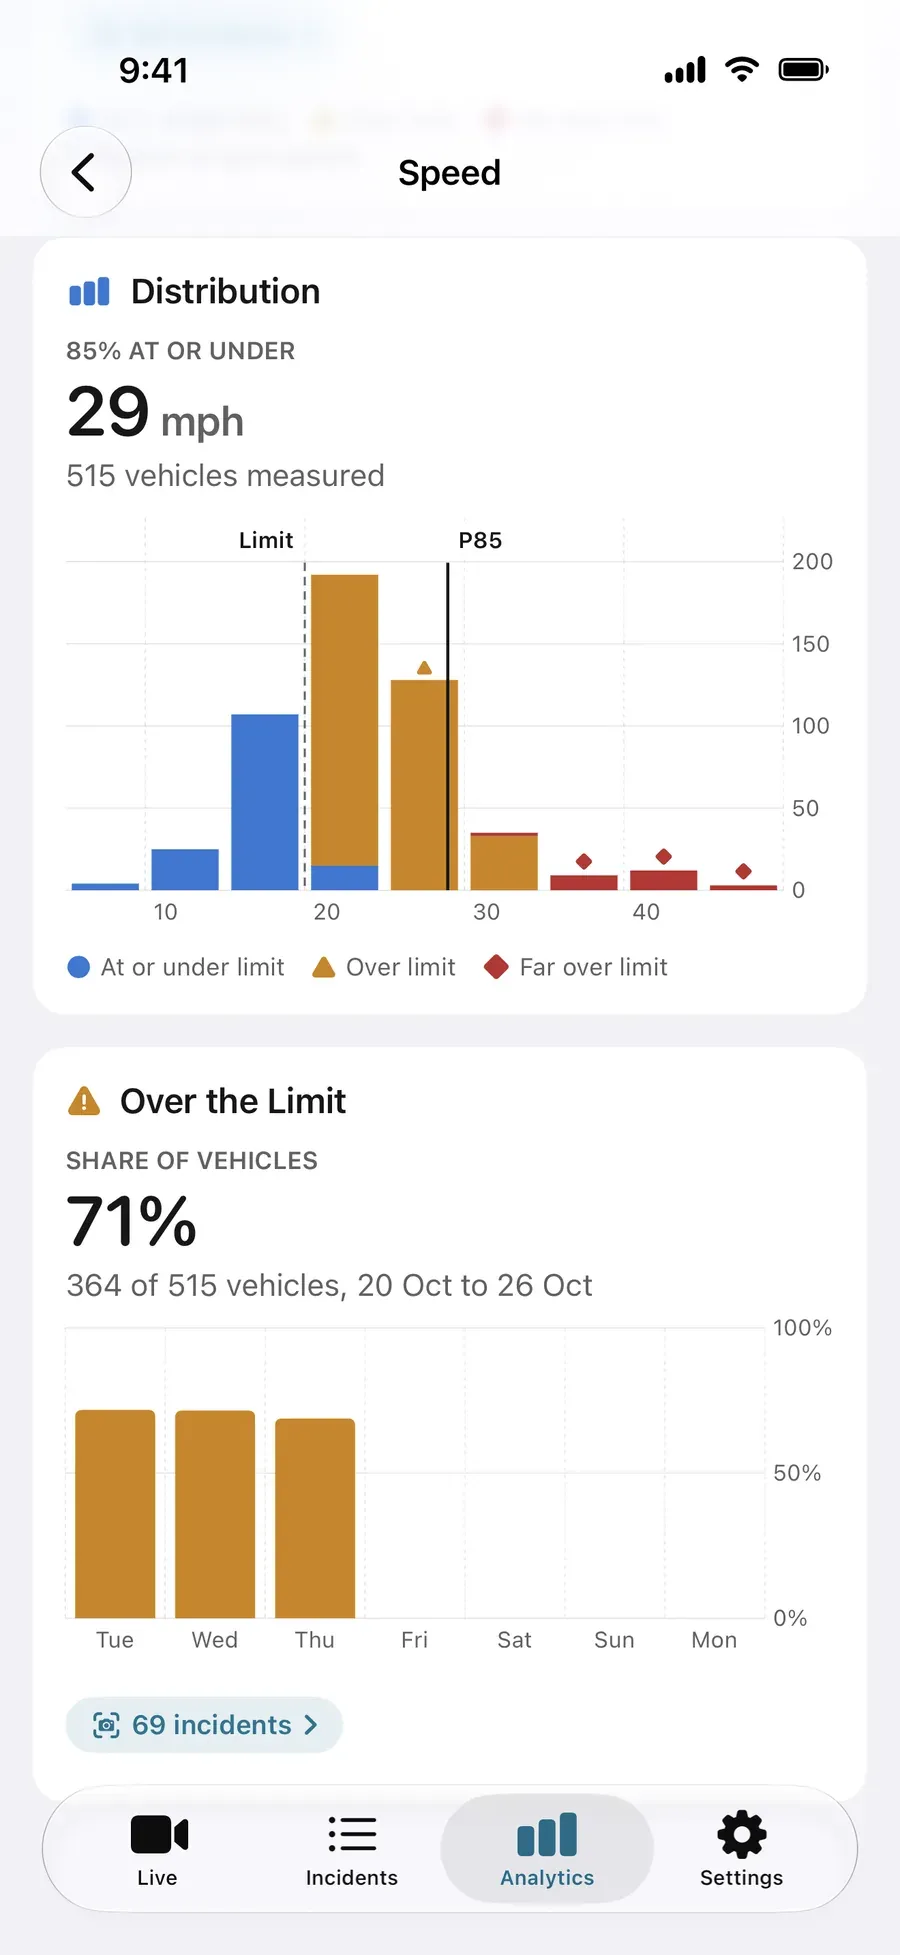
The Speed screen for a week of sample traffic on a 20mph road: 85% at or under 29 mph, a distribution of 515 vehicles with the 20 mph limit dashed and a line marked P85, and below it Over the Limit: 71%, 364 of 515 vehicles
A week of sample traffic on a 20mph road: 364 of 515 vehicles, 71%, went over the limit. Blue is at or under it; orange and red are over.

When to record, how long for, and what each figure means: run your own speed survey of your road.

15 to 21 November 2026

A week to see your own road

Road Safety Week, run by the charity Brake, is 15 to 21 November 2026. If you have wondered what the traffic on your road does, it is a good week to find out: record a weekday school run, an evening and a Saturday, then the same hours again a few weeks later. Live speeds and recording are free, every session keeps the count, the typical speed and the share over 20 mph, and Pro opens the charts.

Sharing it

Something you can attach to an email

In Analytics, choose the period, campaign or session, then export. Everything is made on the phone and shared through the normal iOS share sheet.

PDF report
Your charts, summary figures and a table of captures. The one to attach to an email.
CSV
One row per recorded incident, or one row per measured vehicle, for a spreadsheet.
JSON
The raw records, for anyone who wants to do their own analysis.

What it is

SpeedCam AI shows you the traffic on your own road, each car’s speed as it passes, and keeps a record of your sessions. It is not a speed sign or a radar gun. Nothing is shown to drivers, and your recordings are never sent to us.

More for UK roads

Guides for your road

FAQ

Questions, answered.

Does it work on a 20mph street?

Yes. Set the limit to 20 mph in Settings › Capture › Speed Limit and every chart is measured against it: the share of vehicles keeping to the limit, the speed 85% of traffic stays at or under, and the busiest hour of the day. The limit picker runs from 15 mph up, so 20, 30 and 40 mph roads are all covered, and speeds are shown in mph on a UK iPhone.

Where should I put the phone?

In a window or on a tripod, looking across the road and turned a little to one side, so that cars cross the picture rather than drive towards it. Keep the traffic you want to measure in the nearer lane, close enough that a passing car fills at least a quarter of the picture’s width. For more accurate speeds, measure how high the phone sits above the road and enter it in Settings › Capture › Camera height. Full setup notes on Support.

Do I need a speed gun?

No. Speed comes from your iPhone’s camera and on-device AI, so there is nothing to buy or hold, and nobody has to stand at the roadside. Nothing needs measuring before you start: the app learns your view from the traffic going by. How the two compare: Speed gun or iPhone?.

Can I compare before and after a change?

Yes. Give each set of sessions its own Campaign name in the New Session sheet, such as “Before” and “After”, record the same hours on the same weekdays each time, and choose one campaign at a time in Analytics. Without Pro, each campaign shows its vehicle count, typical speed and share over the limit, and Pro opens its charts and PDF.

Is it free?

Live speeds on screen are free, for as long as you like, with no account, and so is recording. Each session is kept on your iPhone, locked, with its count, typical speed and share over the limit open. Pro opens its photos and the charts of your road, and adds video clips. Choose Annual, which starts with a 3-day free trial for new subscribers, or Lifetime, one payment that never expires and never renews. The short answer is at Is SpeedCam AI free?.

Where does the video go?

Detection runs on your iPhone, and your recordings are never sent to us. With Pro you can keep photos and clips in your own iCloud Drive, which is still your storage, not ours. See Privacy policy for the full policy.

Measure your own 20mph street.

An hour of recording, and you know how fast traffic goes past your door.

Step-by-step setup: how to run a traffic study