
Run your own speed survey of your road, from your window
Record your road at the hours that matter, and the app lays out the count, the speeds and the share over the limit.
A speed survey collects the volume of traffic on a road and the speed it goes, over hours or days. You can make one of your own road, or of the road through your village, with an iPhone in your window and SpeedCam AI: set your road’s limit, record a few sessions at the hours that matter, and the Analytics tab lays out the count, the typical speed, the speed 85% of traffic stays at or under, and the share over the limit. Export it as a PDF to keep or share.
What a speed survey reports, and where it is in the app
| Survey figure | Where SpeedCam AI shows it |
|---|---|
| How many vehicles passed | Vehicles, the first card in Analytics |
| Vehicles by hour of the day | When: a grid of weekdays by hour, and Through the Day |
| Average and typical speed | Average Speed, and Typical Speed (the median) |
| The speed 85% of traffic stays at or under | The Speed card, and 85th percentile in the PDF |
| The share over the limit | Over Limit, against the limit you set |
| Cyclists and people walking | The People card |
1. Set your road’s limit
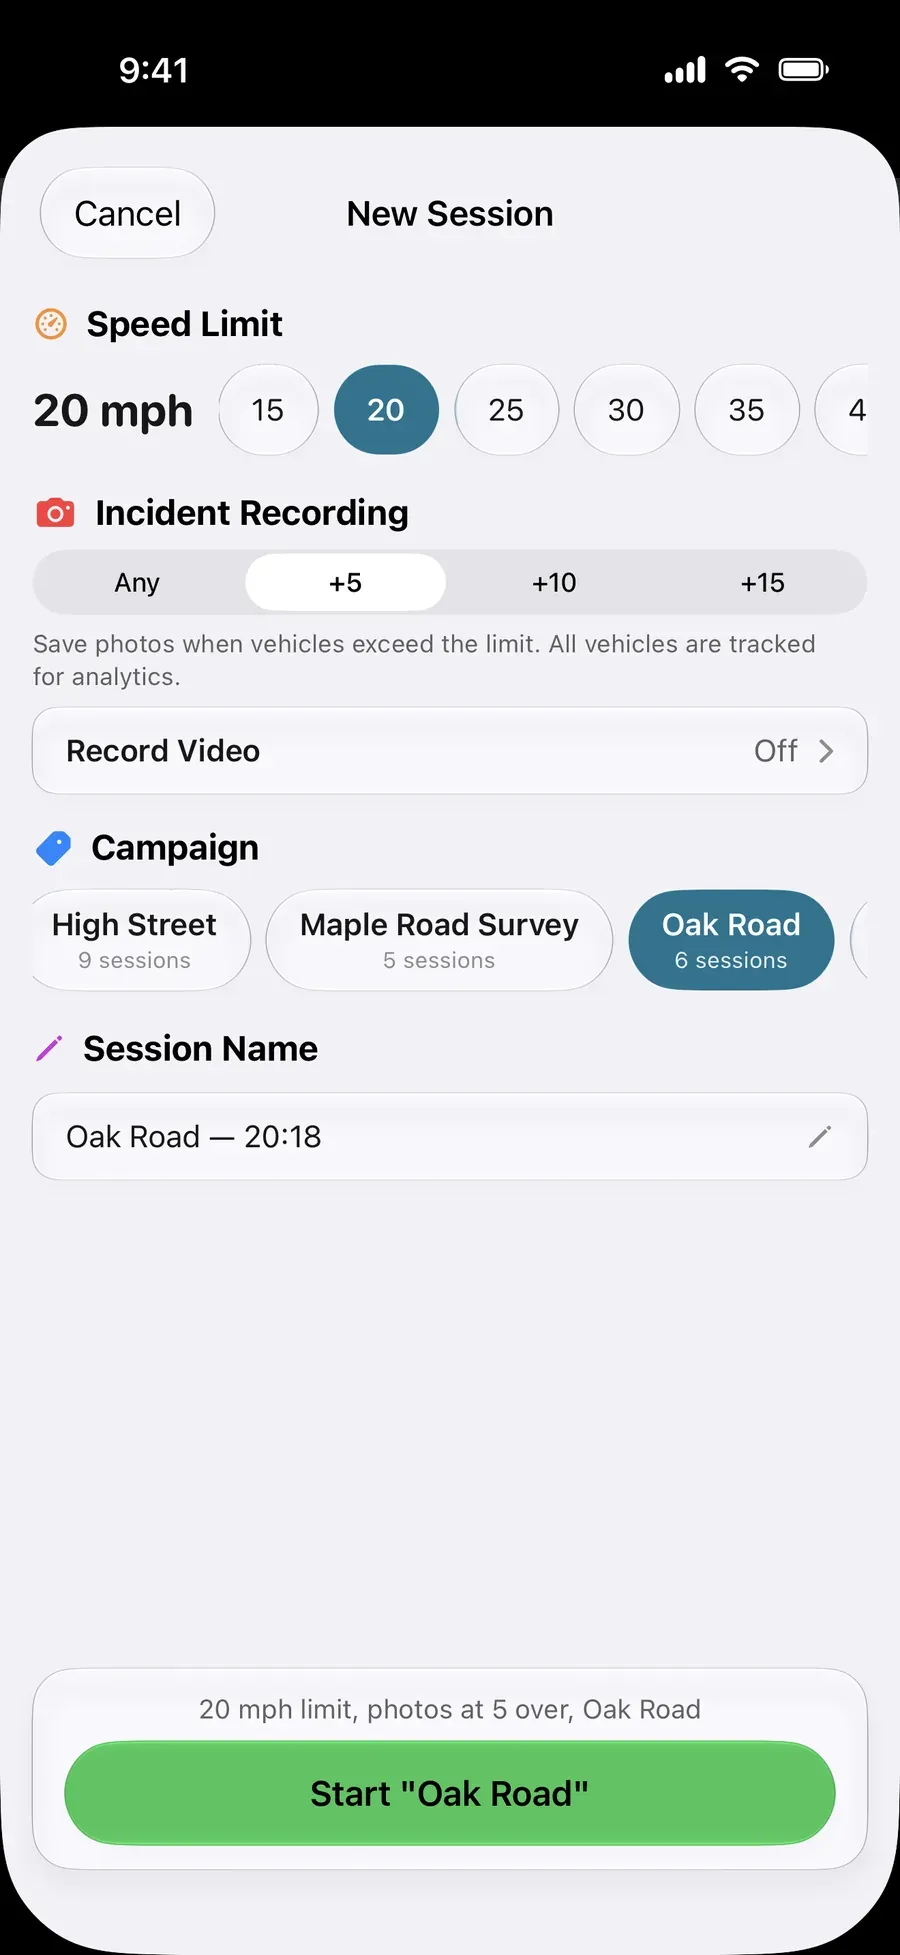
Open Settings › Capture › Speed Limit and choose your road’s limit: 20 mph, 30 mph or whatever it is. The picker runs from 15 mph to 80 mph. You can also set the limit in the New Session sheet when you start, so a session on a 20 mph road and one on a 30 mph road each count against their own limit.
2. Put the phone in a window
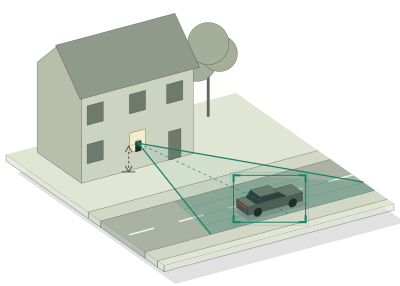
Set the iPhone in a window or on a tripod, looking across the road and turned a little to one side, so cars cross the picture rather than drive towards it. Keep the lane you want to measure close enough that a passing car fills at least a quarter of the picture’s width. For more accurate speeds, measure how high the phone sits above the road and enter it in Settings › Capture › Camera height.
3. Record the hours that matter
One afternoon tells you little about a road. Record at least an hour at a time on three different days, at the hours you want to know about:
- The school run, on a weekday morning and afternoon.
- An evening, when the road is quieter and speeds can be higher.
- A weekend, for the week’s other pattern.
Tap Start Detecting and leave SpeedCam AI open on screen, with the phone on charge: leaving the app ends the session. The app learns your view from the passing traffic: the status at the top reads “Learning this view” and then “Measuring”.
4. Give the sessions one name
In the New Session sheet, type the same Campaign name each time, such as “School mornings”, and the charts roll those sessions up together. To compare two periods, before and after a change on your road, give each set its own name and choose one campaign at a time in Analytics.
5. Read your survey in Analytics
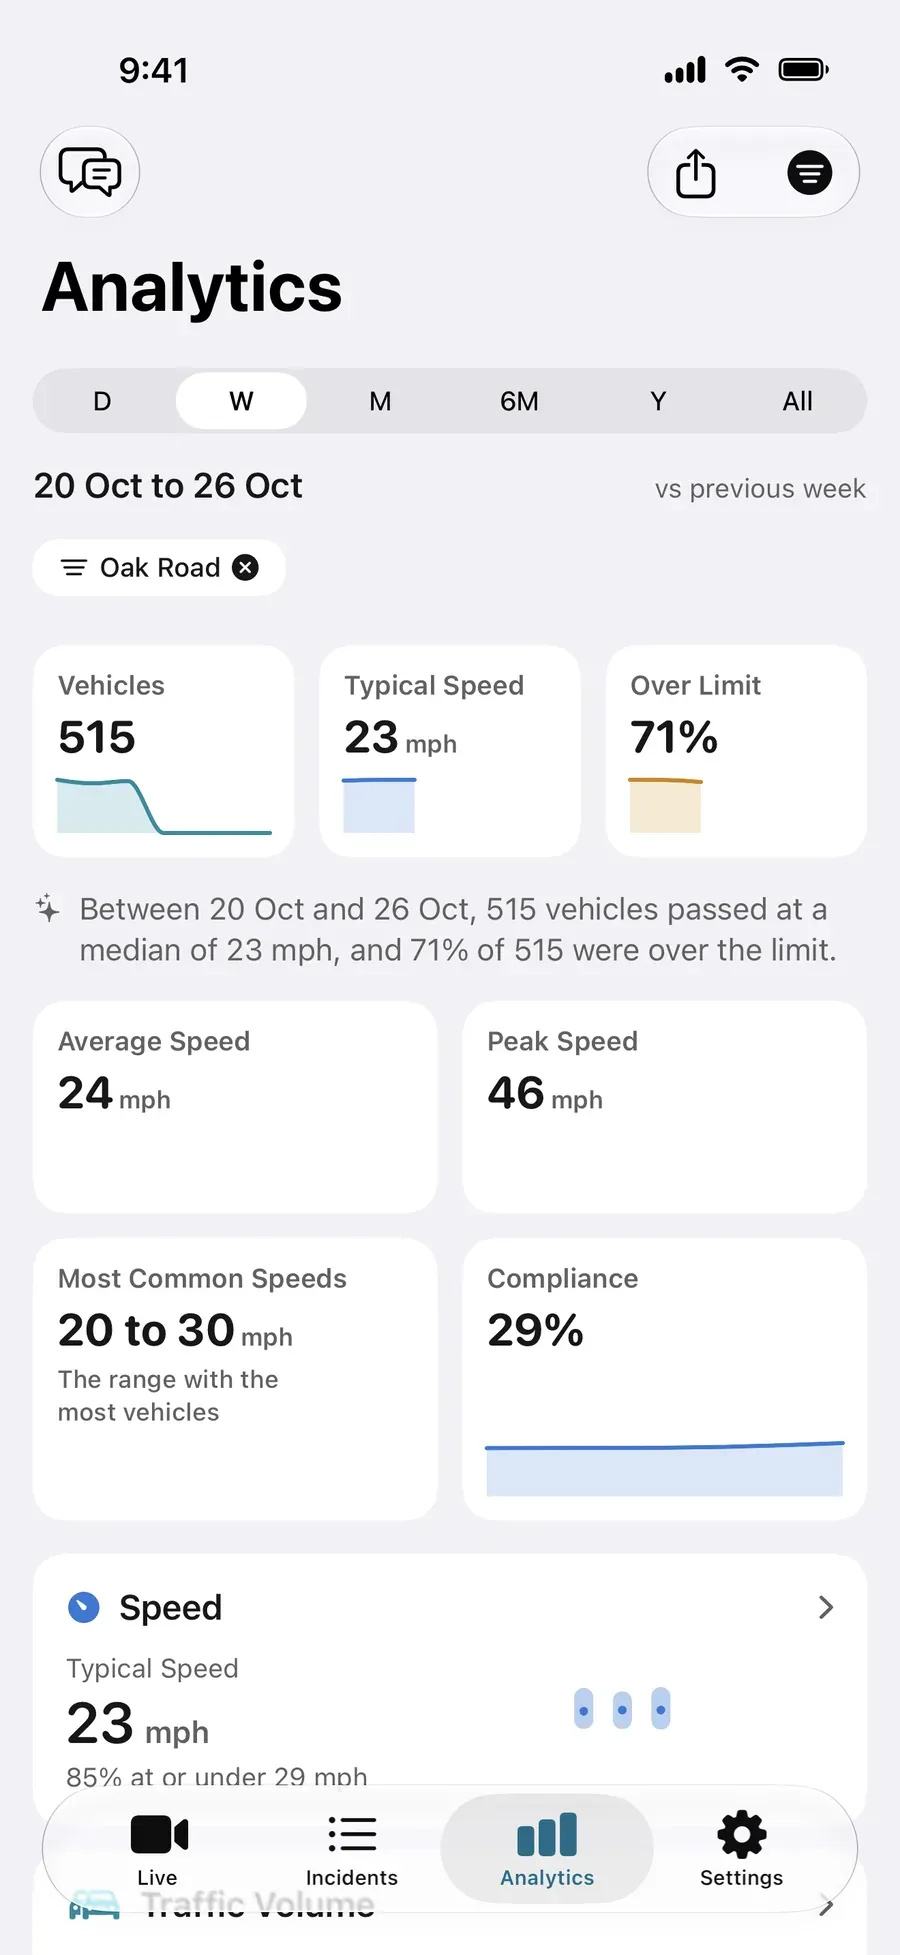
Choose the period at the top, or one campaign, and read the first row: Vehicles, Typical Speed and Over Limit. One sentence under them says the same in words. The Speed card adds the speed 85% of traffic stays at or under, a figure speed surveys usually report, and Compliance shows the share at or under the limit over time.
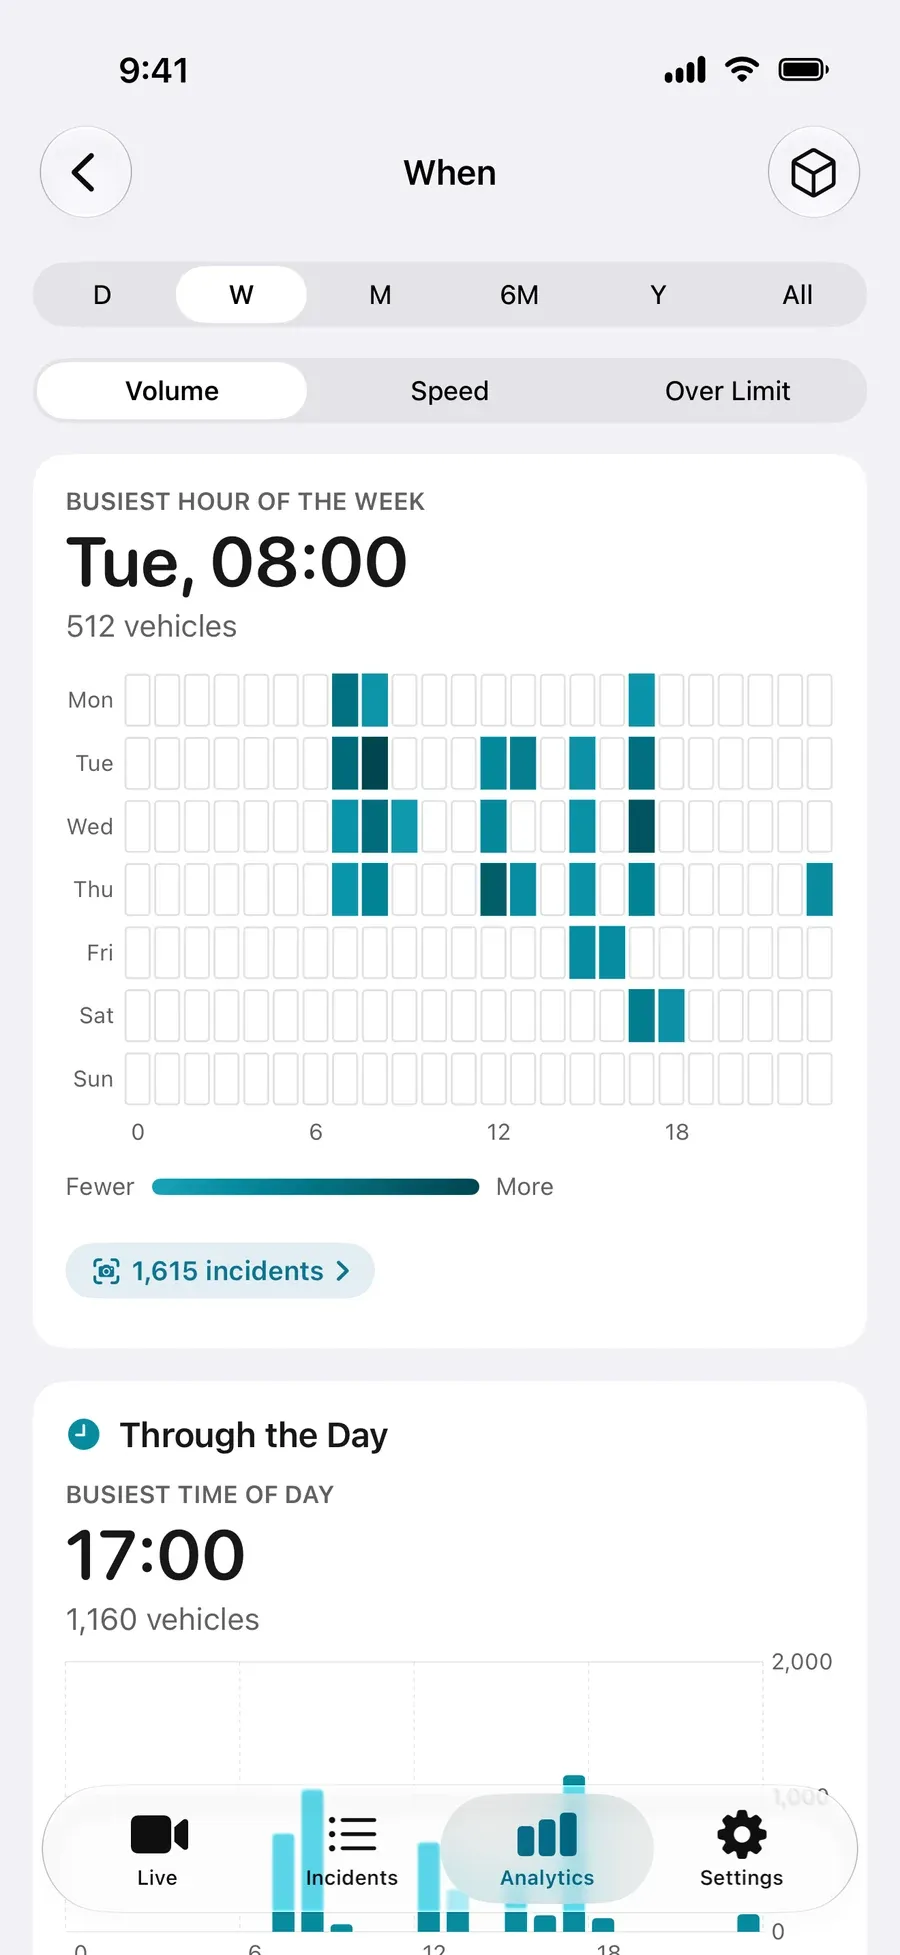
When counts the traffic hour by hour, so the school run stands out. Switch its grid from Volume to Speed or Over Limit to see which hours are fastest. The People card counts cyclists and people walking. People are counted on the live camera. Video imports and IP cameras count vehicles only.
6. Export the PDF
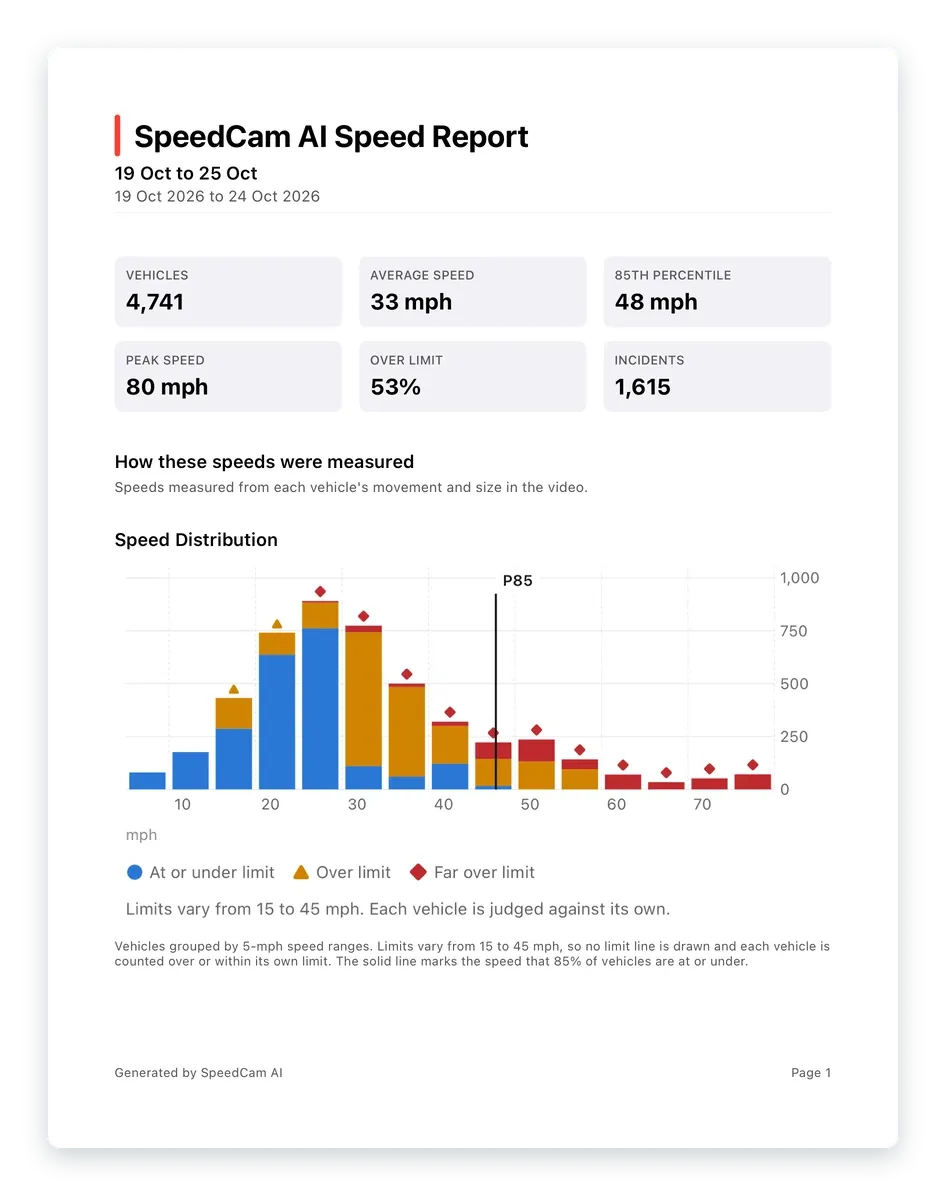
In Analytics, tap export and choose Report (PDF). Its first page has the survey’s summary figures (vehicles, average speed, 85th percentile, peak speed, the share over the limit and incidents), a line on how the speeds were measured, and the speed distribution. The charts and the table of incidents follow. For your own spreadsheet, Vehicles (CSV) lists every measured vehicle with its time and speed. Without Pro, exports cover demo data and recordings that are not locked.
What it is
It is your own survey of your own road: how many vehicles passed, how fast and when, measured on your iPhone. Vehicles are detected on the phone, and your recordings are never sent to us.
Next steps
- SpeedCam AI for UK 20mph streets
- Speed gun for cars, or the iPhone in your window
- What a smiley ‘slow down’ sign would show on your road
- Did 20mph work on your road? See your traffic before and after
- How fast is the traffic past your school at drop-off and pick-up?
- When is my street busiest?
- How to run a neighbourhood traffic study or traffic survey with your iPhone
Questions, answered.
How long should a speed survey run?
Long enough to see a pattern rather than one afternoon: at least an hour at a time, on three different days, at the hours you care about. The school run, an evening and a weekend show how the road changes through the week.
Does it count cyclists and people walking?
Yes. In a saved session, people walking and on bicycles are counted too, and the People card in Analytics shows both, with Pro. People are counted on the live camera. Video imports and IP cameras count vehicles only. Speeds are measured for cars and motorbikes.
Can I compare one fortnight with another?
Yes. Give each set of sessions its own Campaign name in the New Session sheet, such as “Before” and “After”, then choose one campaign at a time in Analytics. Without Pro, each campaign shows its vehicle count, typical speed, share over the limit and 85th percentile, and Pro opens its charts and PDF.
Do I need Pro?
Not to record. Live speeds and recording are free, and without Pro each session is kept on your iPhone, locked, with its headline figures open in Analytics (vehicles, typical speed, the share over the limit, average and peak speed and the 85th percentile). The charts and the PDF report open with Pro. Annual starts with a 3-day free trial for new subscribers, or choose Lifetime, one payment. To see every chart and the PDF first, tap Load Demo Data on an empty Analytics screen. See Pricing.