
Did 20mph work on your road? See your traffic before and after
Record your road before the change and again after it, the same way each time, and see each period’s count, typical speed and share over the limit.
Wales made 20mph the default limit on most residential roads in September 2023, and many other roads across the UK have gone to 20mph too. The question afterwards is whether the traffic on your own road slowed down. Published evaluations, such as Edinburgh’s, compare a road’s speeds before the change and after it. You can do the same for your road with an iPhone in your window: record before and after, the same way each time, with each period under its own name.
1. Record before the change
Start as soon as you know a change is coming. Set the iPhone in a window or on a tripod, looking across the road and turned a little to one side, and note exactly where it stands: the after sessions should see the road from the same spot.
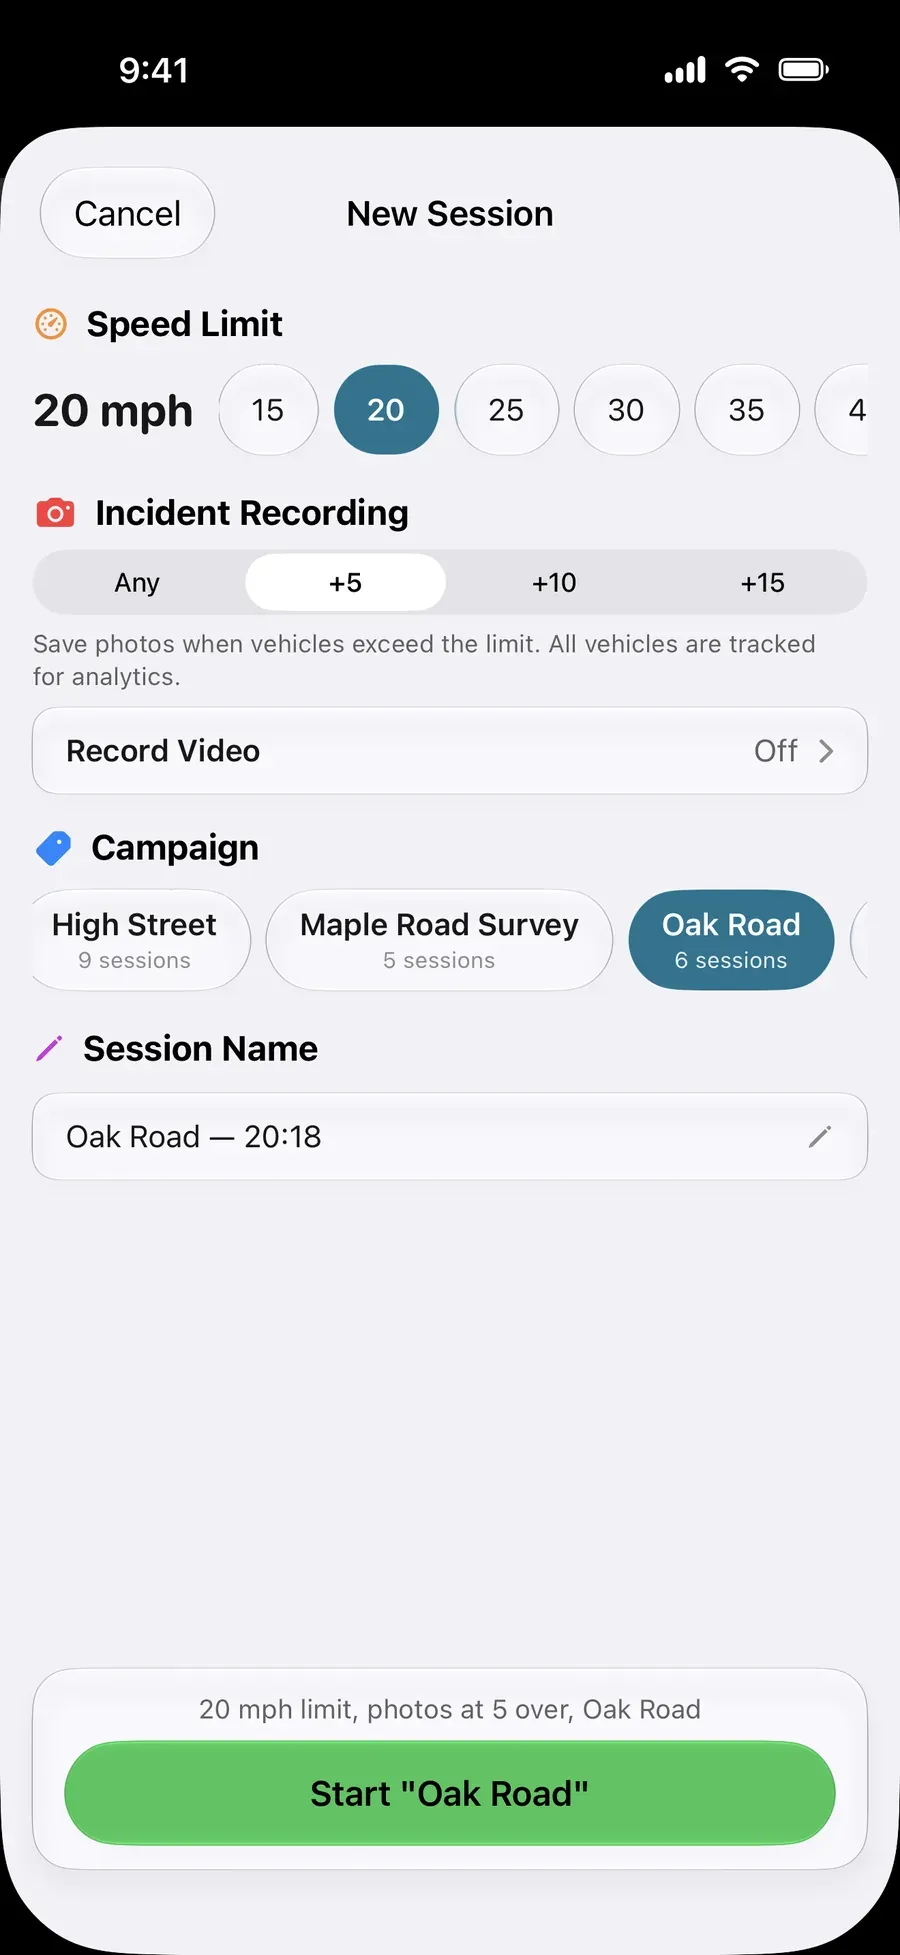
Record the hours you care about, at least an hour at a time on three different days: a school-run morning, an evening and a Saturday, say. In the New Session sheet, give every one of these sessions the same Campaign name, such as “Oak Road before”, and set the Speed Limit.
If a session went under the wrong name, move it: in the Incidents tab, open the filter sheet, touch and hold the session and choose Move to Campaign…
2. Record after, the same way
Give the change a few weeks to settle in, then record again: the same spot, the same hours and the same weekdays, under a second Campaign name such as “Oak Road after”. Keep school holidays out of one period if they are not in the other, so the two compare like for like.
Each session keeps the limit it was recorded with, and every vehicle is measured against its own session’s limit. If the limit went from 30 to 20, a before session at 30 mph shows the share over 30, and an after session at 20 mph the share over 20. To see the share over 20 in both periods, set 20 mph for the before sessions too, when you start them: Edit Speed Limit on a past session changes its figures.
3. Read each period in Analytics
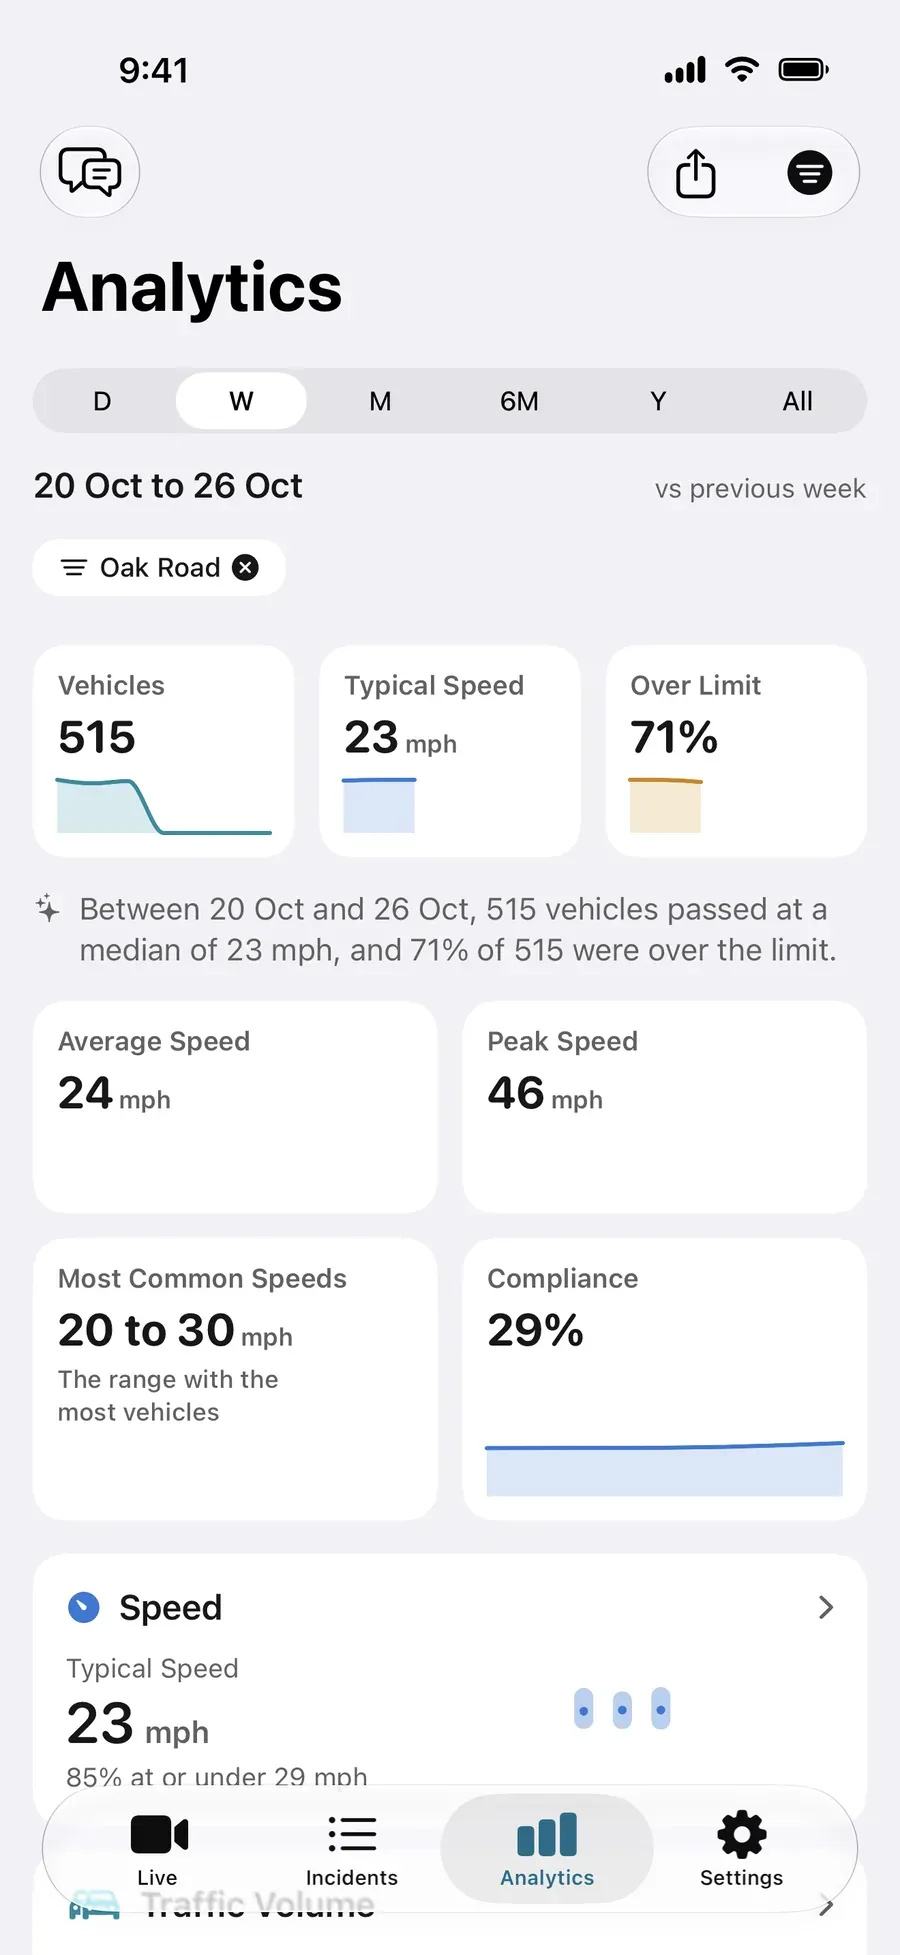
Open Analytics, tap Filter, and under Campaign choose the before period. Choose All at the top to take in every session of that campaign, note what each figure shows, then choose the after period:
| Figure | Where it is | What a change would show |
|---|---|---|
| Vehicles | The first card | Whether as many vehicles still use the road |
| Typical Speed | The second card | The median speed, half the traffic at or under it |
| Over Limit | The third card | The share of vehicles over the limit each session was recorded with |
| The speed 85% of traffic stays at or under | The Speed card | Whether the faster drivers slowed down |
| The busiest and fastest hours | When: Volume for the busiest hours, Speed for the fastest, Over Limit for the highest share over the limit | Whether the school run changed as much as the rest of the day |
Without Pro, the first three figures and the 85th percentile sit on the Locked card for the campaign you choose, and the Speed card and When open with Pro.
Analytics shows one campaign at a time; there is no side-by-side view. The small arrows on the first three cards compare the period on screen with the same span just before it, vs previous week for example, not one campaign with another, and with All chosen there are none.
4. Put the two side by side
With a campaign chosen, Export in Analytics follows it. Export a Report (PDF) for the before period and another for the after period, or each one’s Vehicles (CSV) to put both in one spreadsheet. Two PDFs side by side are easy to share with your neighbours. Without Pro, exports cover demo data and recordings that are not locked.
On a US street with a new speed hump
The method is the same for a speed hump, a speed cushion or a new sign on a US street. Record before it goes in and after drivers have got used to it, at the same hours from the same window, each period under its own campaign, and compare the speed 85% of traffic stays at or under. For the steps before a hump goes in, see what does it take to get a speed hump on your street?
What it is
It is your own before and after of your own road: how many vehicles passed, how fast and when, in each period, measured on your iPhone. Vehicles are detected on the phone, and your recordings are never sent to us.
Next steps
Questions, answered.
Did 20mph work on my road?
Your own numbers can show you. Record your road before the change and again after it, at the same hours from the same spot, each period under its own Campaign name. Analytics then shows each period’s vehicles, typical speed, share over the limit and the speed 85% of traffic stays at or under.
How long after the change should I record?
Give drivers a few weeks to get used to it, then record the same hours on the same weekdays as before. Keep school holidays out of one period if they are not in the other.
Can I see both periods side by side?
Analytics shows one campaign at a time: choose the before campaign, read it, then choose the after one. To put them side by side, export a PDF report or Vehicles (CSV) for each period.
The limit changed from 30 to 20. Which limit should the sessions use?
Each session keeps the limit it was recorded with. To see the share over 20mph in both periods, set 20 mph in the New Session sheet for the before sessions too. Do it when you start them: Edit Speed Limit on a past session changes its figures.
Does it work for a speed hump or a new sign?
Yes. The method is the same for any change: record before it, record after it the same way, and compare the two periods.
Do I need Pro?
Not to record. Live speeds and recording are free, and without Pro each session is kept on your iPhone, locked. Analytics still shows each campaign’s vehicles, typical speed, share over the limit and 85th percentile. The Speed card, the other charts and the PDF report open with Pro. Annual starts with a 3-day free trial for new subscribers, or choose Lifetime, one payment. Load Demo Data on an empty Analytics screen shows every chart first. See Is SpeedCam AI free?