
When is my street busiest?
Record your street at the times that matter, and the When screen lays the week out hour by hour.
The short answer: record your street with SpeedCam AI across the hours and days you care about, then open Analytics › When. It names the busiest hour of the week and the busiest time of day, and colors a grid of weekdays by hour so the quiet and busy hours stand out at a glance.
Count every vehicle, not just the fast ones
In a saved session, SpeedCam AI counts every vehicle that passes the camera: cars, trucks, buses and motorcycles, and cars and motorcycles also get a speed. The When screen is built from those vehicles. Bicycles and people walking are counted too, in their own People chart in Analytics. People are counted on the live camera. Video imports and IP cameras count vehicles only.
Record the hours you want to compare
Set the iPhone in a window or on a tripod, looking across the road and turned a little to one side, so traffic crosses the picture. Then tap Start Detecting and leave the phone on screen.
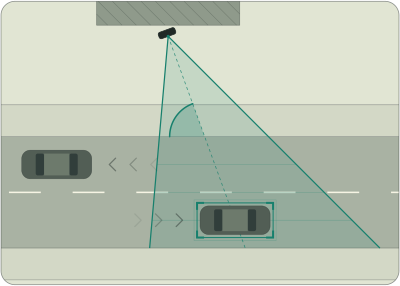
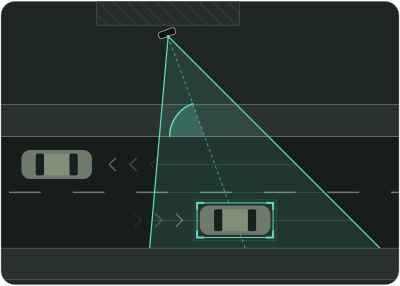
The grid can only show the hours you recorded, so spread your sessions out: a weekday morning, the school run, an evening, a weekend. Tag sessions by place, such as “Oak St”, and the charts roll them up together; tag them by time or by change, such as “before the speed bump”, to compare one set with another.
Recording is free, and each session is kept on your iPhone. Without Pro it is locked, and Analytics shows its vehicle count and typical speed. The When screen opens with Pro, and Load Demo Data on an empty Analytics screen fills it with sample traffic before you subscribe.
Read the week on the When screen
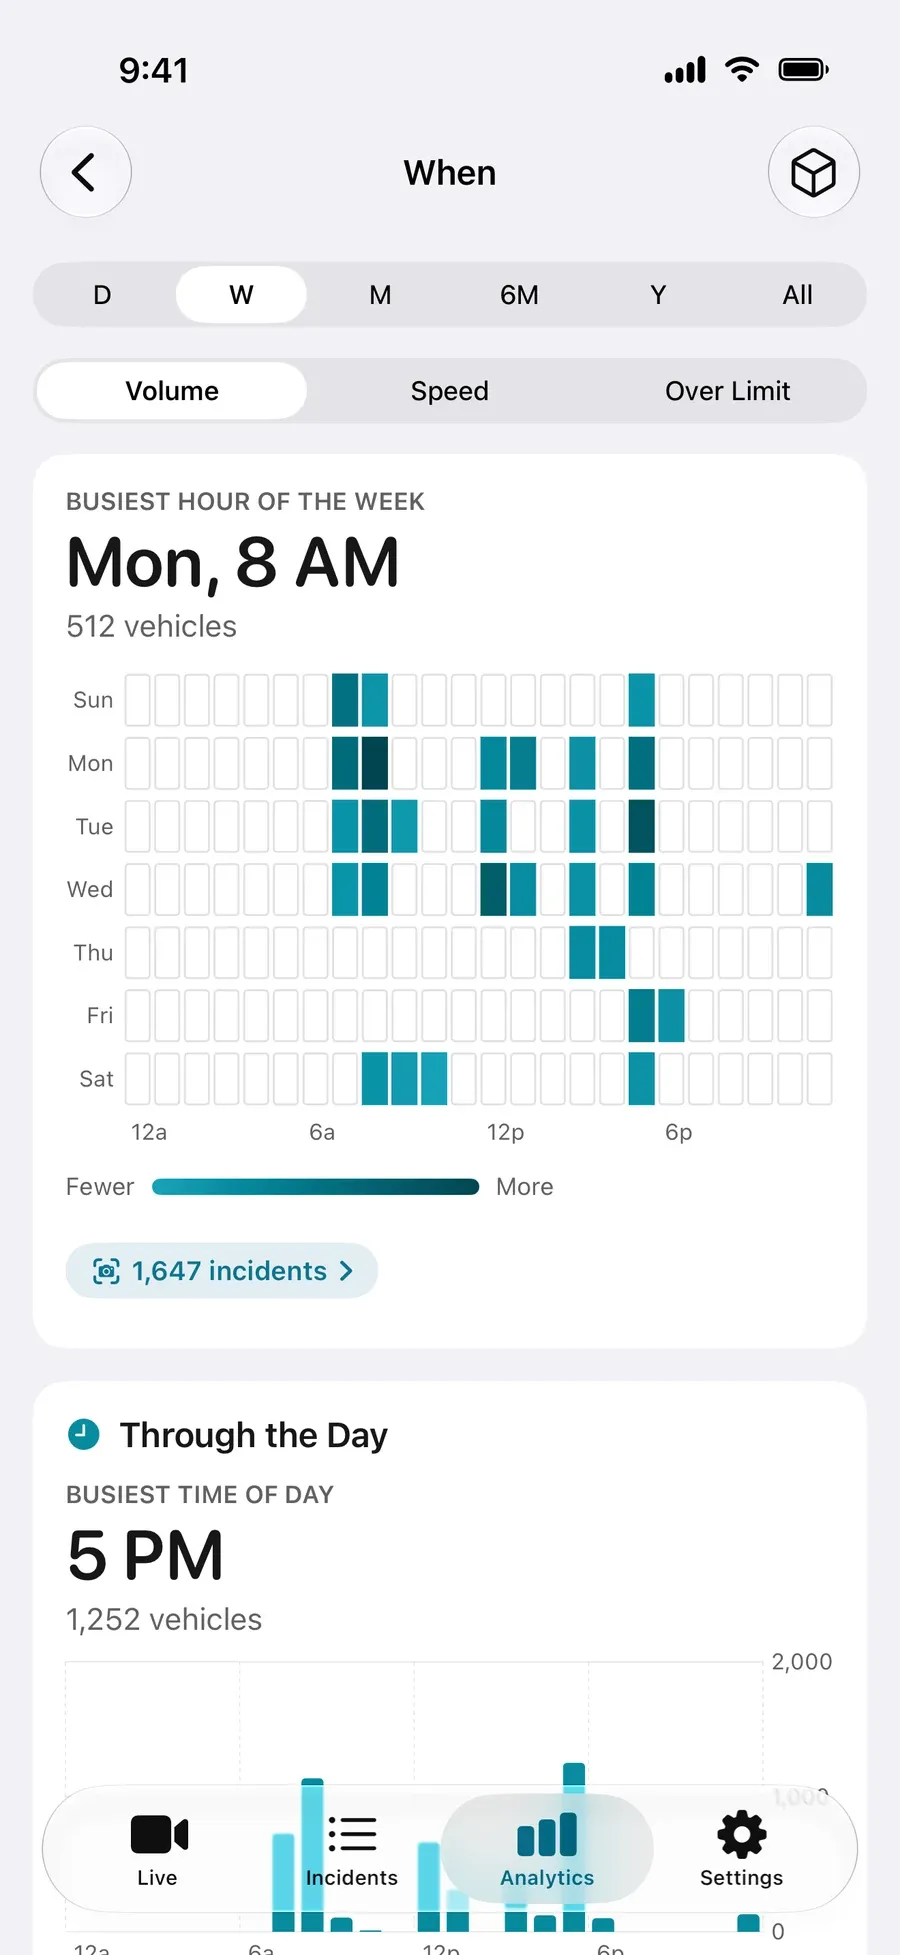
- Busiest hour of the week sits at the top, with how many vehicles it carried.
- The grid has a row per weekday and a column per hour. In Volume, darker cells carried more vehicles.
- Switch the grid to Speed to see when the typical speed is highest, or to Over Limit to see when the highest share of vehicles goes over your limit. The busiest hour and the fastest hour are often not the same.
- Through the Day folds every day together and names the busiest time of day.
- Choose the period at the top, and tap the incidents link to open the incidents behind the grid.
To share what you found, export a PDF report from Analytics. It charts the speed distribution, the share over the limit over time, traffic by hour and the vehicle types, and adds a risk heatmap when the period has traffic on three or more separate days and some vehicles went over the limit. For the raw numbers, Vehicles (CSV) has a row for every vehicle, with its time and, where one was measured, its speed. Incidents (CSV) and Incidents (JSON) hold only the incidents, the vehicles saved for going over your limit by the margin you chose. Without Pro, exports cover demo data and recordings that are not locked.
What the numbers are
Vehicles are detected on your iPhone, and your recordings are never sent to us. SpeedCam AI is a consumer tool for neighborhood awareness and personal traffic studies. It is not intended for any legal, insurance or enforcement process.