
What does it take to get a speed hump on your street?
Before you ask for a speed hump, see your street’s speeds first: the two numbers many city programs look at, and where SpeedCam AI shows them for your street.
Diese Anleitung ist derzeit nur auf Englisch verfügbar.
Many US cities run a program for speed humps and other traffic calming on residential streets. You ask, the city measures your street with its own traffic study, and it decides from what it measures. Many programs publish what they look for, and it often comes down to two numbers: the speed 85% of traffic stays at or under, called the 85th percentile speed, and the share of drivers over the limit. Before you ask, you can see both for your street with an iPhone in your window.
What city programs look at
Each city sets its own rules and updates them, so read your own city’s page first. Three published examples, in each city’s terms as of October 2026:
| City | What its program looks at |
|---|---|
| Kirkland, Washington | A street that is not an arterial, with two lanes or fewer, a limit of 25 mph or lower and 300 to just under 4,000 vehicles a day, where a city traffic study finds at least 15% of vehicles going at least 5 mph over the limit. Speed cushions, the kind with gaps for fire trucks, need at least 15% going at least 7 mph over, after lighter measures have been tried. |
| Prescott, Arizona | For speed humps and other measures that slow traffic, the city’s page sets the 85th percentile speed at 7 mph over the posted limit: on a 25 mph street, 32 mph or above. Its Traffic Calming Policy (2019) puts it as greater than 7 mph over. The policy also asks for a petition: signatures, for or against, from at least 90% of the households or businesses in the petition area; at least 75% of the residents and businesses affected in favor; and every property directly fronting or next to the measure in favor. |
| Columbia, Missouri | For speed humps and other physical measures, a paved residential street with at least 400 vehicles a day and an 85th percentile speed of 33 mph, or 250 vehicles a day and 38 mph. Residential streets there are 25 mph unless posted otherwise, and a request starts with a call to Public Works or a petition of 10 signatures. |
The figures are the cities’ own, and so is the traffic study each one runs before deciding.
The two numbers, in plain words
- The 85th percentile speed is the speed 85% of traffic stays at or under. No more than 15% of drivers go above it, so a few very fast cars do not move it much, and a street where many drivers go fast moves it a lot.
- The share over the limit is how many drivers out of every hundred go over the posted limit.
Kirkland’s test is a share of drivers, as the app’s Over Limit is: Kirkland counts the drivers at least 5 mph over the limit, and Over Limit counts every driver over it.
See them for your street first
Set your street’s limit. Open Settings › Capture › Speed Limit, or set it in the New Session sheet when you start. Every chart measures against it.
Put the phone in a window. Look across the road, turned a little to one side, so cars cross the picture, and keep the lane close enough that a passing car fills at least a quarter of the picture’s width. For more accurate speeds, enter how high the phone sits above the road in Settings › Capture › Camera height.
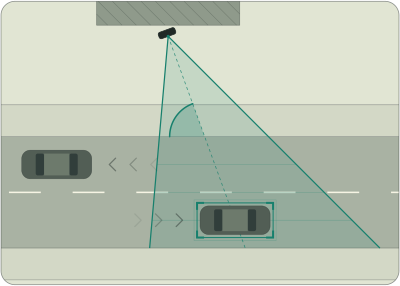
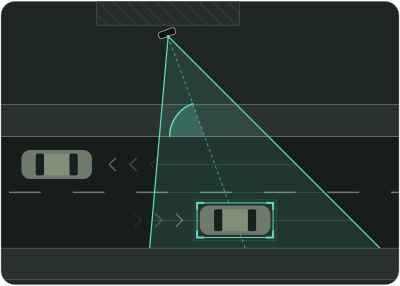
Record the hours that matter. Tap Start Detecting in the bar at the bottom of the Live view and leave the app open on screen, with the phone on charge. Record at least an hour at a time, on a few different days: a weekday morning, the school run, an evening.
Read the numbers in Analytics. Choose the period at the top. Over Limit in the first row is the share over your limit, and the Speed card gives the speed 85% of traffic stays at or under. Without Pro, both figures sit on the Locked card.
City programs count vehicles a day. The app counts the vehicles in the hours you record, so its count is a vehicles-a-day figure only if you record a whole day.
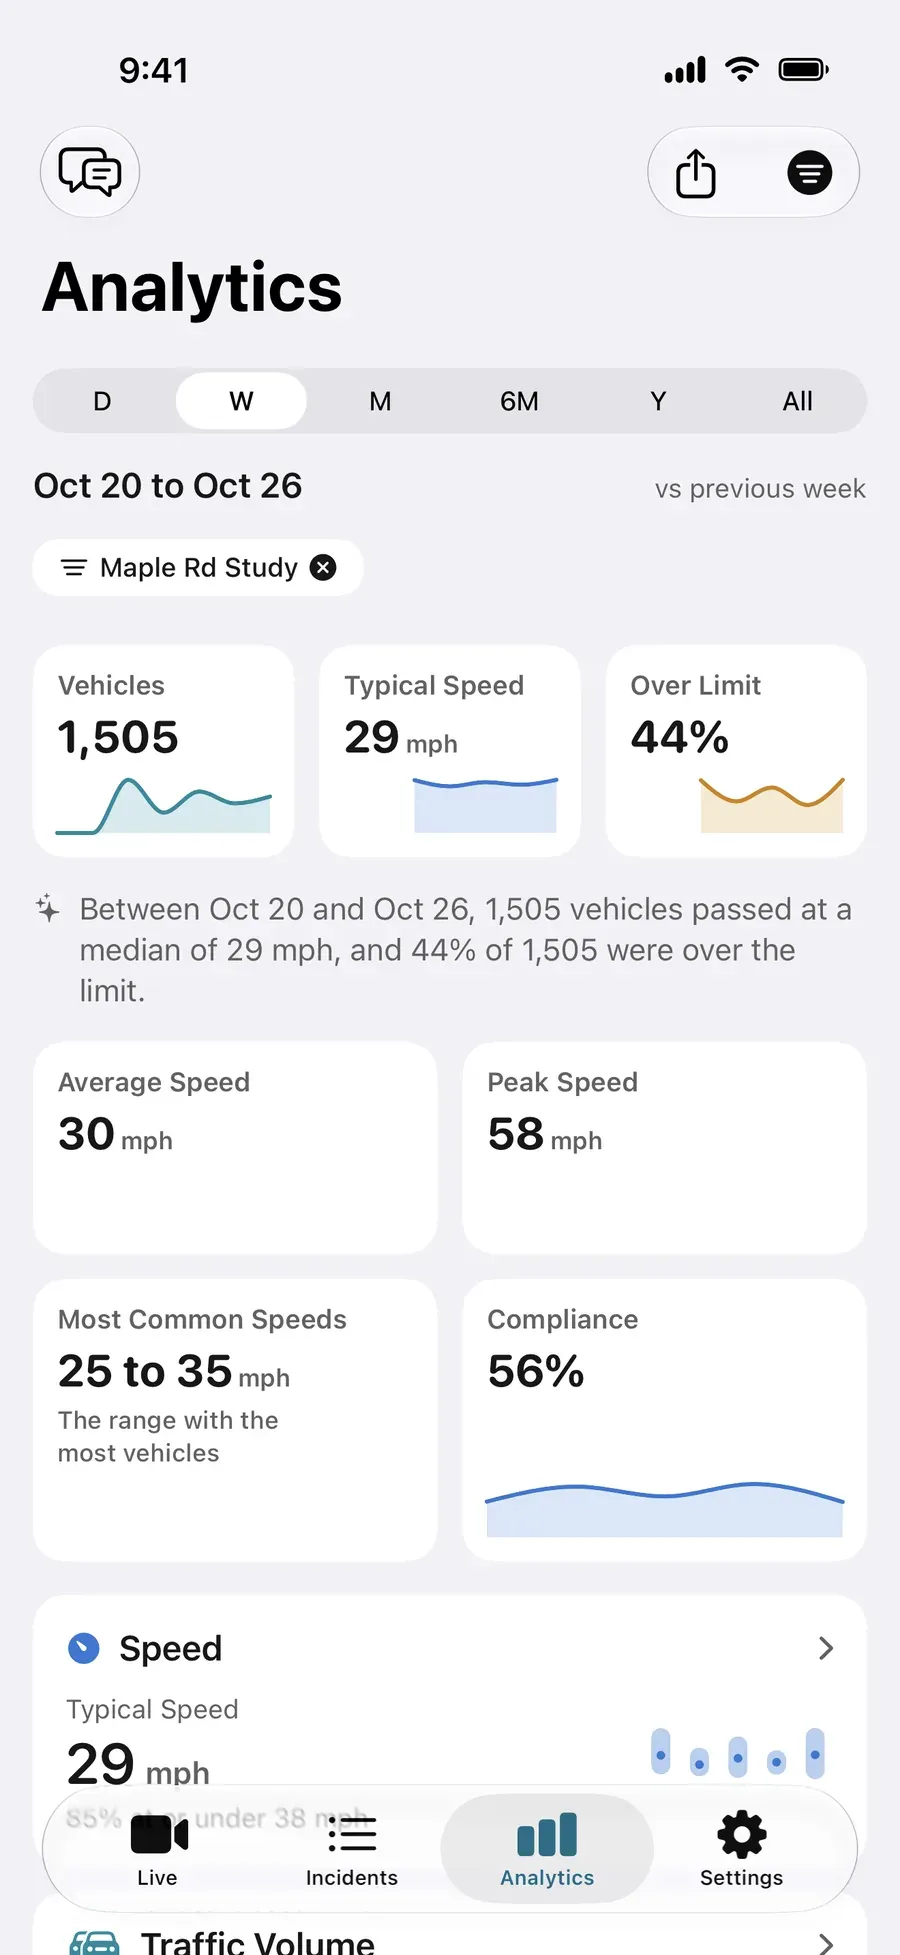
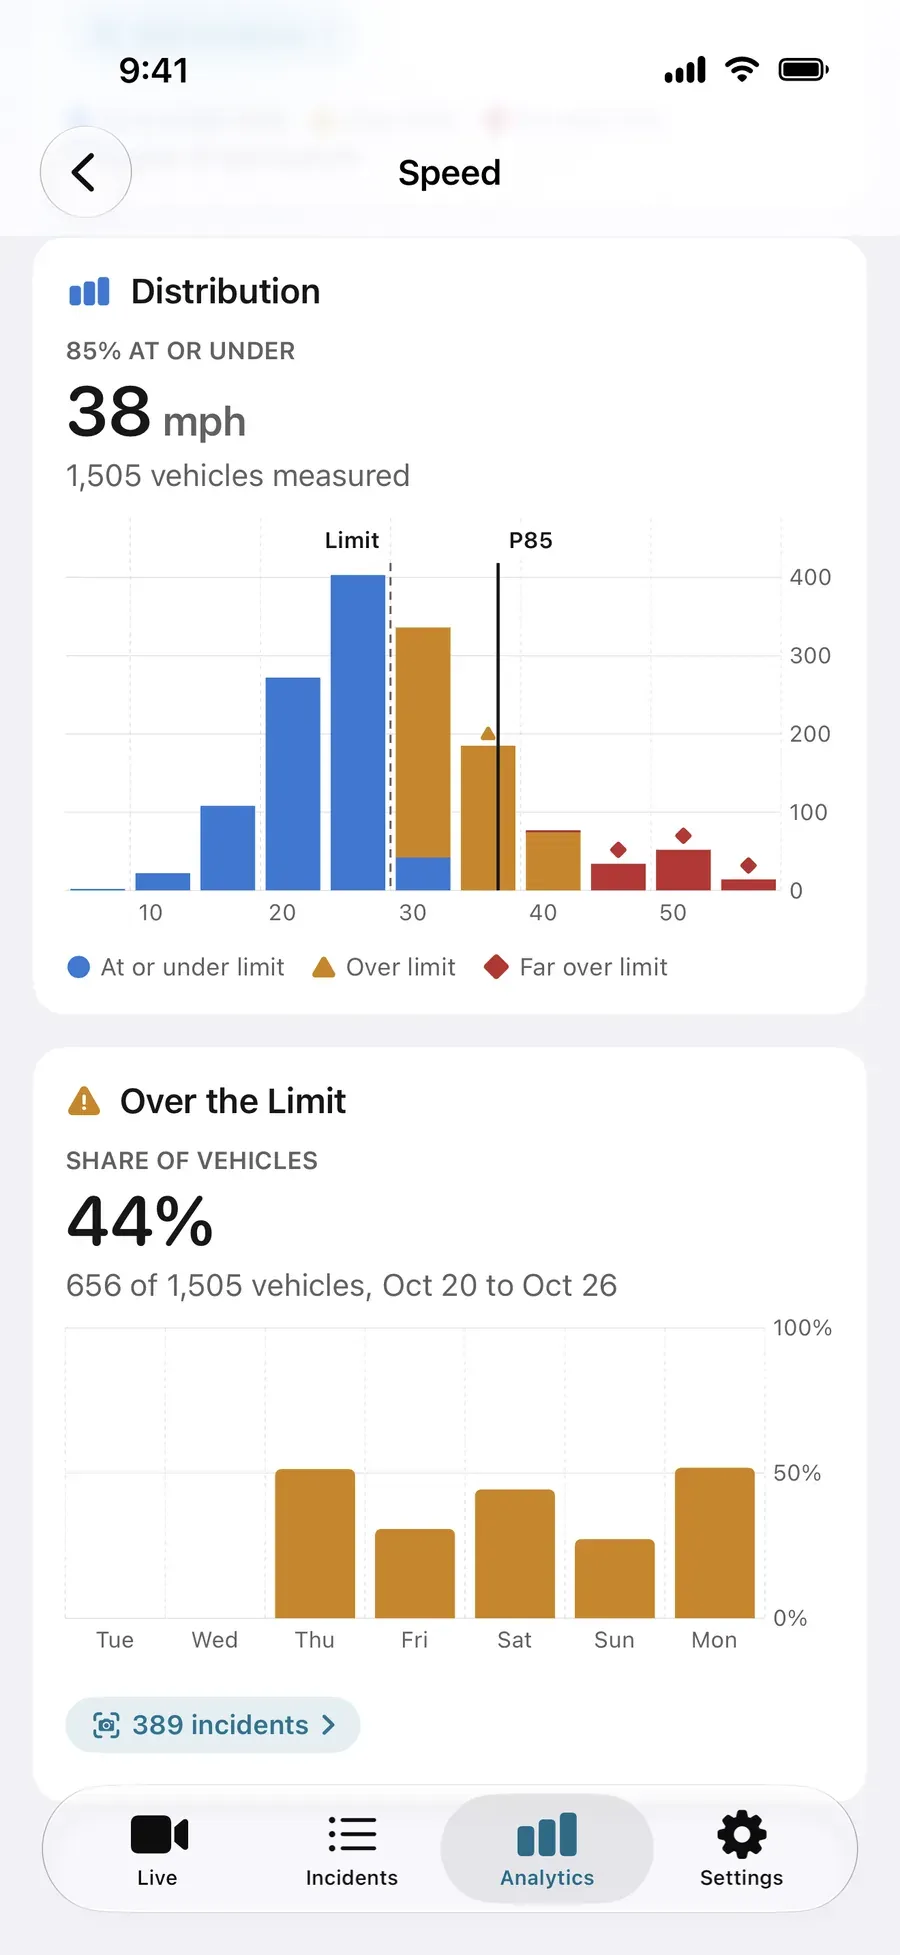
Tap the Speed card for the Distribution of speeds, with a line marked P85 at the speed 85% of vehicles are at or under, and Over the Limit, the share over the limit through the period. The PDF report puts the same figures on its first page.
Before and after a change
If your street gets a speed hump, a speed cushion or new signs, record it again the same way. Give the sessions before the change one Campaign name in the New Session sheet, such as “Before”, and the sessions after it another, such as “After”. In Analytics, choose one campaign at a time from the filter, or export a PDF of each, and the two sets sit side by side: the share over the limit and the 85th percentile, before and after.
What it is
It is your own count of your own street: how many vehicles passed, how fast and when, measured on your iPhone. Your city runs its own study and decides from its own figures. Vehicles are detected on the phone, and your recordings are never sent to us.
Next steps
- See your street’s traffic before and after a change, once the hump is in
- Speeding on my street: how many cars go over the limit?
- What is the 85th percentile speed, and how to work it out for your street, with a calculator
- Measure the speed of passing cars with your iPhone
- How to run a neighborhood traffic study or traffic survey with your iPhone
- When is my street busiest?
Fragen, beantwortet.
How do I get a speed bump on my street?
Start with your city’s traffic calming or speed hump program: many US cities have a page with a request form and the criteria. The city then measures your street with its own traffic study and decides from what it finds. Most programs also ask for your neighbors’ support. Before you ask, SpeedCam AI on your iPhone shows the speed 85% of your street’s traffic stays at or under, and the share over the limit.
What is the difference between a speed hump and a speed bump?
A speed hump is a rounded rise across a street, typically 12 to 14 feet long in Prescott’s description, built to slow traffic on residential streets. A speed bump is the short, sharp kind found in parking lots. Many people say speed bump for both.
What is the 85th percentile speed?
The speed 85% of vehicles stay at or under, so no more than 15% go above it. Many city programs use it to describe how fast a street is driven. In SpeedCam AI it is on the Speed card in Analytics and in the PDF report, and without Pro it shows on the Locked card in Analytics.
Does the city measure my street itself?
Yes. In each of the programs on this page the city runs its own traffic study and decides from its own figures. SpeedCam AI shows you where your street stands before you ask, and what changes after.
Do I need Pro?
Not for the two numbers. Live speeds and recording are free, and without Pro each session is kept on your iPhone, locked, with its 85th percentile and share over the limit on the Locked card in Analytics. The distribution on the Speed card, the other charts and the PDF report open with Pro. Annual starts with a 3-day free trial for new subscribers, or choose Lifetime, one payment. Load Demo Data on an empty Analytics screen shows every chart first. See Pricing.